Questions from Tableau Training: Conditional Coloring on Sparklines

Data

Questions from Tableau Training: Conditional Coloring on Sparklines

Our Certified Tableau Trainers are asked a myriad of questions each day. In this series, they share some answers.

In the Tableau Desktop III: Advanced course, we teach you how to build sparklines, with the added bonus of using a dual axis to create a circle for the last sales value. This circle highlights that final point on the line, making it slightly easier to see. One of my participants wanted to take things to another level and focus on the last point in relation to whether it increased or decreased from the previous value. With well-chosen colors, this distinction can enhance your sparklines by quickly showing which dimension values might need more attention (e.g. areas that have gone down since the last time period).

“Can we color a point based on whether it went up or down compared to the previous point?”

The answer to this question is fairly straightforward. You just need to follow these steps:

  1. Start with a dual-axis sparkline (one mark for the line, another for the points).
  2. Create a calculated field to determine if a point is greater or less than the previous point.
  3. Bring that calculated field to Color on the Marks card that creates the circle mark.


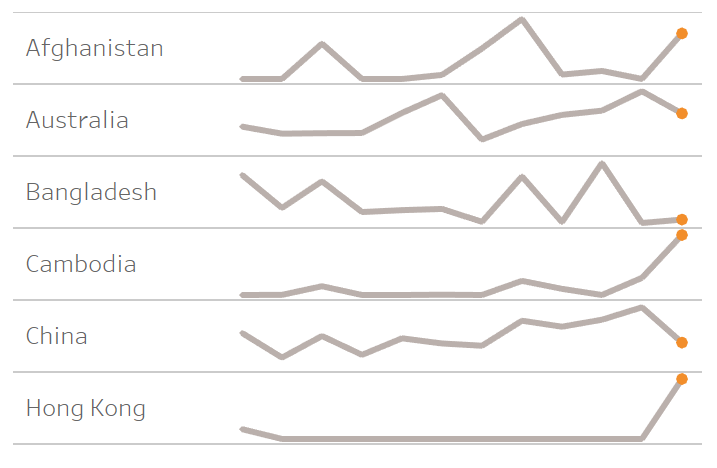
The chart in the Desktop III: Advanced course leaves us with a sparkline that looks like the one below. All the circles at the end are one color (orange), regardless of whether that value is higher or lower than the previous value.

Tableau Training Sparklines

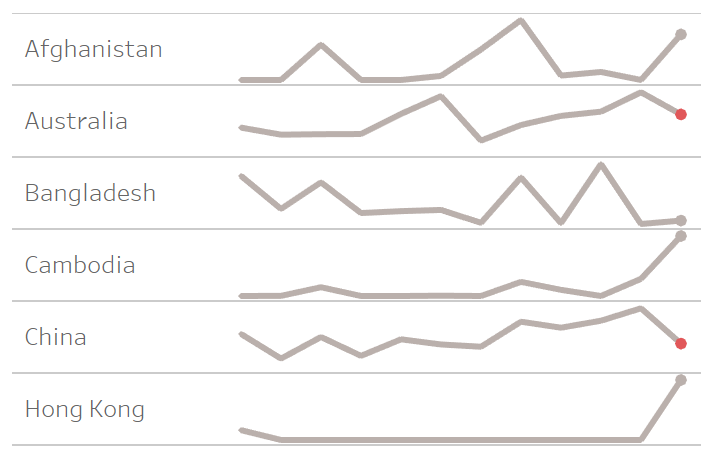
To take this up a notch, a simple calculated field used on Color will color circles based on whether the last value went up (grey) or down (red) in relation to the previous value. Being thoughtful about color usage here means we will use a bolder color—red—to draw our users’ eyes to areas that need attention and minimize distractions with the softer grey. Which of these two chart options do you find more useful?

Tableau Training Sparklines

Here is the calculation to achieve this:

Tableau Training Sparklines calculation

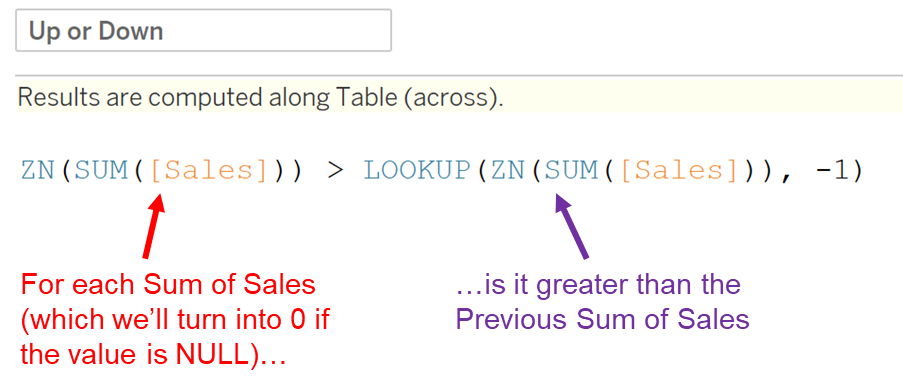
ZN() returns 0 if the Sum of Sales for a particular point is NULL. Otherwise, it returns our Sum of Sales. This is a form of error handling: comparing a sales value to NULL will yield NULL (which we don’t want), while comparing a sales value to 0 will yield TRUE or FALSE.

LOOKUP() is a table calculation that returns the Sum of Sales in a target column as determined by the offset, which is -1 in this calculation. With Compute Using set to Table (Across), that means looking one column to the left (to the previous month in this case).

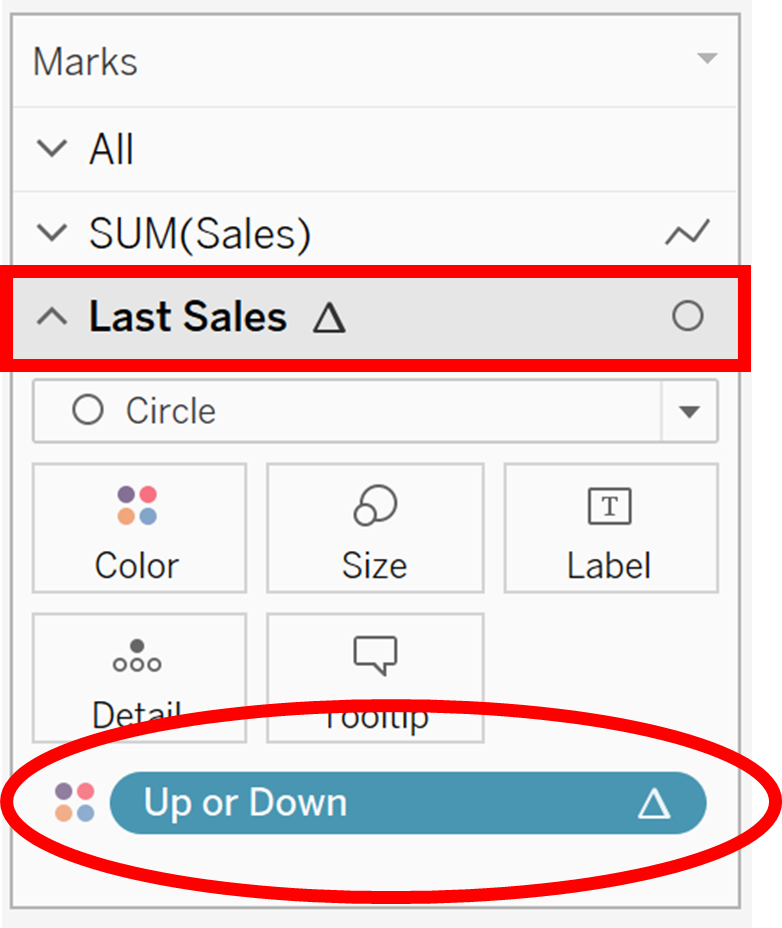
Now, bring the calculated field just created to Color on the Marks card that is creating your circle mark. In our case, the sparkline is comprised of a dual axis: one mark for the line, the other mark for the circle. Since LOOKUP() is a table calculation, you can set the Compute Using options on this Up or Down pill to Table (Across) once you bring it on to Color:

Tableau Training Sparklines conditional coloring

Now click on Color to edit the colors for TRUE and FALSE. Consider which value you want to emphasize, and make that a bolder/brighter color, leaving the other value softer/lighter. Now you’ve got a great-looking chart with colored points that draw your viewers’ eye exactly where you want it to go!

Want More Questions from Tableau Training

  1. Questions from Tableau Training: Quick Filter Interaction
  2. Questions from Tableau Training: Labeling with Table Calculations
  3. Questions from Tableau Training: Speeding Up Presentation Views when Using Tableau
  4. Questions from Tableau Training: Dashboard Actions
  5. Questions from Tableau Training: Business Day Calculations
  6. Questions from Tableau Training: Adding Gaps Between Bars
  7. Questions from Tableau Training: When to Pivot Data in Tableau
  8. Questions from Tableau Training: Adding Conditional Formatting
  9. Questions from Tableau Training: Setting Weekday Start
  10. Questions from Tableau Training: How Do ZIP Codes Work in Tableau?
  11. Questions from Tableau Training: The Small Grey Bar Within a Quick Filter
  12. Questions from Tableau Training: Matching Mark Color
  13. Questions from Tableau Training: Showing the Null Indicator
  14. Questions from Tableau Training: Can I Manually Set the Colors of a Stepped Gradient?
  15. Questions from Tableau Training: How Can I Get Box Plot Data into a Crosstab?
  16. Questions from Tableau Training: How Do I Clear a Worksheet? Make a Copy?
  17. Questions from Tableau Training: Opening URL Actions Inside of a Dashboard
  18. Questions from Tableau Training: Can I Move Mark Labels?
  19. Questions from Tableau Training: How Can I Use My Current Report to Create a Viz?
  20. Questions from Tableau Training: Can I Create Text Hyperlinks on a Dashboard?
  21. Questions from Tableau Training: How Can I Transform My Crosstab into a Flat List?
  22. Questions from Tableau Training: Labeling the Top N
  23. Questions from Tableau Training: How Can I Customize Charts with Parameters?
  24. Questions from Tableau Training: Combining Measures into a Single Line
  25. Questions from Tableau Training: How Can I Create Custom Color Palettes?
  26. Questions from Tableau Training: Can a Top N Parameter be Nested Within Other Fields?
  27. Questions from Tableau Training: Conditional Scope on Tableau Calculations
  28. Questions from Tableau Training: Top Ten Plus N
  29. Questions from Tableau Training: Dynamic Label Positioning
  30. Questions from Tableau Training: Using Cross Joins to Solve Active Tickets
  31. Questions from Tableau Training: Top N Highlight Table
  32. Questions from Tableau Training: How to Use Specific Dimensions in Table Calculations
  33. Questions from Tableau Training: Moving Reference Line Labels
  34. Questions from Training: Comparing Metrics for Same Weekday in Previous Year
  35. Questions from Tableau Training: Colouring Specific Columns and Rows in a Crosstab
  36. Questions from Tableau Training: Creating a Custom Legend as a Sheet
  37. Questions from Tableau Training: How Can I Draw a 45-Degree Angle?
  38. Questions from Tableau Training: Down the Aggregation Rabbit Hole
  39. Questions from Tableau Training: Percent Change from Previous Period on a Map
  40. Questions from Tableau Training: Union File Names as Years
  41. Questions from Tableau Training: Conditional Coloring on Sparklines
  42. Questions from Tableau Training: Moving Column Headers to the Top of the View
  43. Questions from Tableau Training: Isolating Rank with Parameters and Calculations

More About the Author

Brenden Goetz

Analytics Consultant
Dashboard Confessions: Wrestling with Impostor Syndrome One of my first publicly available dashboards is embarrassingly rough. Just two charts (one’s a pie; thank goodness it only has three ...
Celebrating Black History Month Through Cinema A few weeks ago, I saw If Beale Street Could Talk and experienced yet another representation of the way injustice persists in our ...

See more from this author →

InterWorks uses cookies to allow us to better understand how the site is used. By continuing to use this site, you consent to this policy. Review Policy OK

×

Interworks GmbH
Ratinger Straße 9
40213 Düsseldorf
Germany
Geschäftsführer: Mel Stephenson

Kontaktaufnahme: markus@interworks.eu
Telefon: +49 (0)211 5408 5301

Amtsgericht Düsseldorf HRB 79752
UstldNr: DE 313 353 072

×

Love our blog? You should see our emails. Sign up for our newsletter!