
This series reveals there's more to being an analytics consultant than meets the eye. The InterWorks team shares candidly about the struggles and challenges they've grappled with throughout their careers. You may think you know, but you have no idea...
One of my first publicly available dashboards is embarrassingly rough. Just two charts (one’s a pie; thank goodness it only has three slices), gaping whitespace, completely emotionless. Like a decent dashboard, it begs more questions, but some of them could actually be answered in that sea of space. Not that every inch of a dashboard needs to be consumed with charts and text; whitespace used strategically is a great design practice.
But how much is too much? And those colors? They are part of the color palette laid out in our organization’s brand manual … but did I use them in an effective way? What’s my boss going to think of this? What are the people in the community I built this for going to think? Is it good enough? Am I good enough? You can see how the spiraling begins …
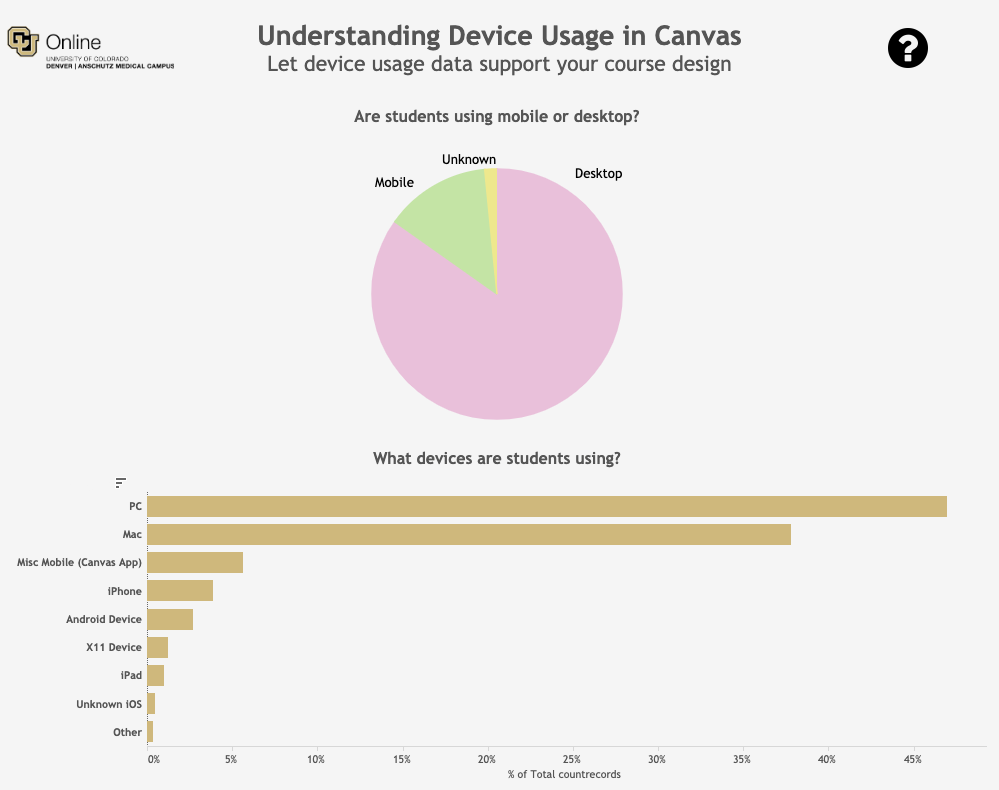
Above: Interact with the full dashboard on Tableau Public
Are You an Impostor?
There’s a fascinating paradox I’ve been learning about over the years of feeling like I am not good enough at what I do. Turns out that many of the highly accomplished people I look up to also feel like they aren’t quite good enough. Whether it’s Cory Richards recounting his accomplishment (and sense of inadequacy) of the first winter ascent of an 8000m peak in the film Cold, or a data analyst for the New York Times feeling like he’s not good enough to work at one of the most prestigious news sources in the world, I kept seeing more and more examples of highly successful people feeling like they were frauds. Maybe my fraudulent-feeling dashboards weren’t so bad after all?
What I was feeling is Impostor Syndrome. It has been called out increasingly in the professional world, and Fast Company summarized Dr. Valerie Young’s work on the topic quite succinctly. It’s the idea that you are not good enough to be doing what you are doing and that you will eventually be discovered as a fraud. The creative process of designing dashboards is rife with opportunities for feeling like what you’re doing is not good enough, especially when you see beautiful dashboards being built all around you. I see great dashboards all over the place, so I know what they look like, but I just felt like the work I was producing didn’t live up to the ambitious designs I had in my mind.
Does It Get Better?
Dr. Young breaks down Impostor Syndrome into five different types of impostors, and the two that resonate with me the most are The Perfectionist and The Natural Genius. The Perfectionist feels like 100% of their work needs to be 100% good all of the time, and I’ll be honest: having a company mindset of always producing the very best work adds to that pressure. The Natural Genius impostor believes that competence is tied to the speed and ease with which you are able to accomplish things, so the slower I was at slogging through dashboard design and the less perfect those designs were, the harder I was on myself.
But I kept plugging away. Per Dr. Young’s advice, I took mistakes in stride and honored them as part of the process. I shared work before I felt like it was finished. I took tangible steps to improve my design process. This meant collaborating with and learning from colleagues like Keith Dykstra. It meant observing and learning to teach Tableau’s Visual Analytics course. It meant becoming vulnerable and sharing my dashboards in our Viz Lab, inviting feedback from my colleagues.
And eventually I started to feel better about the work I was producing.
I participated in a few Viz for Social Good projects and came up with the dashboard below. It has a more strategic use of color, utilizes icons to elicit emotion and offers answers to more questions. I never really felt like this was finished—I’d love to make the map more useful, and the Top Risks heat map has some weird formatting when published to Tableau Public—but I got it out, and thanks to feedback from the Viz Lab, it’s much better than the original:
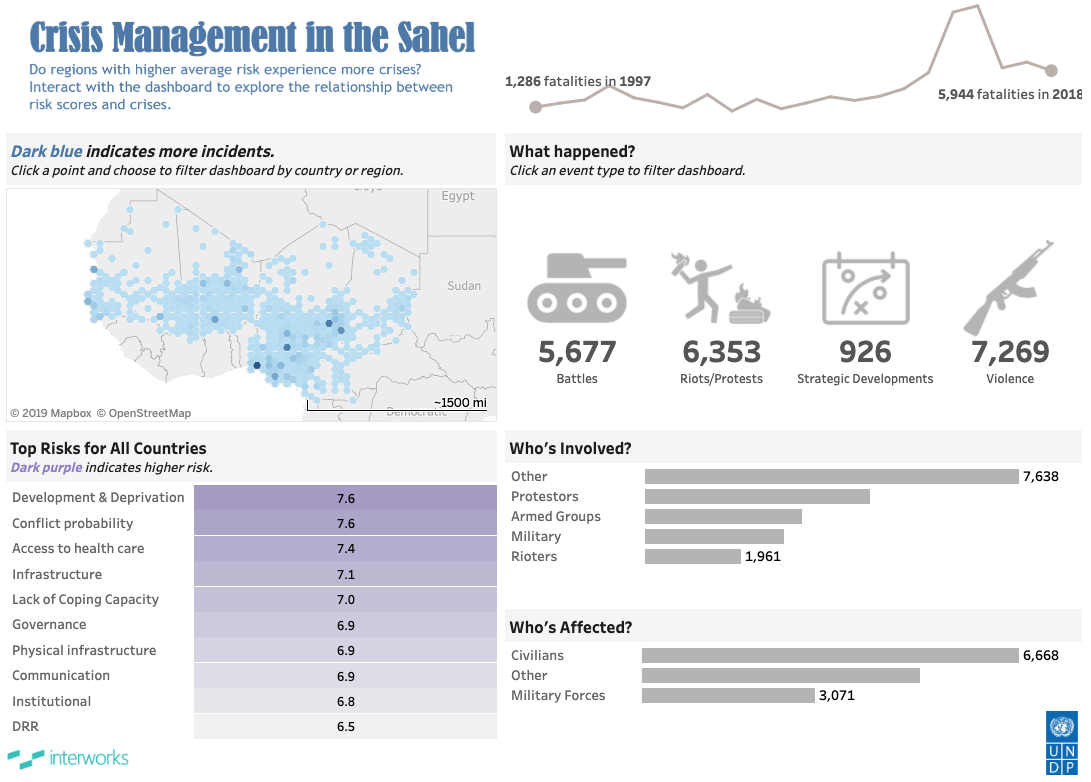
Above: Interact with the full dashboard on Tableau Public
And then I embarked on a project for Black History Month that won Viz of the Day. It went through about seven iterations to get to that point, but I finally started feeling like the work I was producing wasn’t so fraudulent. It helps to get external recognition, but ultimately, I was beginning to believe that even if I don’t know everything, I do know what I am doing:

Impostors and Consultants
It can be embarrassing to share things that aren’t good, especially as a consultant when clients have high expectations for you to be the expert. But it’s incredibly valuable to understand that part of the process of making good things is making things that are NOT good. The good news is that if your work disappoints you, it probably means you have the taste to recognize good work, as well as the potential to achieve it. You just need to put in the effort, continue to produce work, and close the gap between what your good taste shows you’re capable of producing and what you’re actually producing now to get there.
Above: Ira Glass on Storytelling from David Shiyang Liu on Vimeo
So, what can you do to help yourself? Continue to develop your skills by checking out our available webinars, our UI Checklist for Dashboards and this blog with tons of dashboard design resources. Consider taking Tableau’s Visual Analytics course. Keep doing work. And when you need to commiserate, throw on Dashboard Confessional’s The Places You Have Come to Fear the Most. Because sometimes you can’t fake it hard enough to please everyone. Or anyone at all.