On a recent project, I heard a colleague recommend dbt and it sounded amazing. Every feature of this product seemed to address challenges I run into on almost every data project. I decided it was time to take a look.
Unravelling the Spaghetti
As a consultant, I often get introduced to new data sets. If you’ve recently joined a data team or had a new member join you, then you’ll recognize this experience too.
Briefing sessions are often a roller coaster ride where years of organic development and the complexities of business logic get compressed into a few minutes while you do your darndest to take in as much as you can.
To understand what is happening, I’ll generally spend time drawing out how data is flowing from one place to the next along its journey.
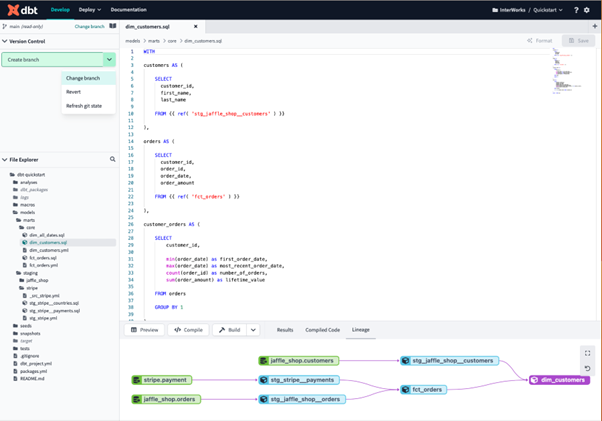
dbt encourages and helps build this documentation as you go. The starting point is an interactive lineage diagram that lets you see at a glance how the data is flowing from one place to the next. In the example below, the fct_orders view is selected, and the arrows show upstream and downstream dependencies.
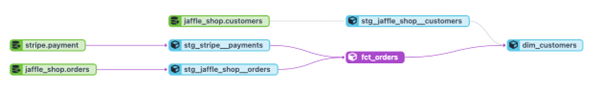
Above: Lineage diagram in dbt.
Working DRY
Analysts are often under pressure to solve the problem of the day and get results fast. This can lead to complexity: for example multiple transformations taking place in a single view and the same solution being built in multiple places.
dbt encourages DRY (Don’t Repeat Yourself) design. This is far easier to do if you have a good overview of your data flow and can build individual steps that can be re-used.
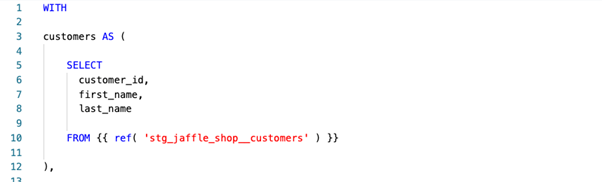
This is supported by a system of flexible references that link individual steps together. For more complex tasks, dbt provides pre-built packages that can be integrated into your project.
Building and Collaborating Safely
Before discovering dbt, it had never occurred to me that SQL can be treated exactly like any other code – for example, Python. This opens up the option to use powerful and proven revision management tools. In dbt, the SQL is housed in a git repository and the cloud interface guides you along the way.
Now I can work with colleagues or develop new functionality knowing that my production version is always protected and available.
I no longer need to think of saving SQL files with version numbers as I work and collaboration becomes a workable option for me and other developers on the team.
Conclusion
This is just an introduction to dbt – the tool can do far more than I show here. It is a tool for analysts that are comfortable working in SQL. While dbt manages the SQL code, the actual execution is done in the database. This means analysts can work with the SQL they already know and can depend on the power of the database to deliver results fast.
It is easy to try this out for yourself. Individual developers can set up a free account that gives unlimited room to experiment for as long as you wish. There are some great tutorials and datasets available to get started too.
If you would like to see dbt in action feel free to reach out to me. I’m a fan and always happy to show you why!