Our Certified Tableau Trainers are asked a myriad of questions each day. In this series, they share some answers.
In a Desktop II: Intermediate course I recently taught, a student asked, “When would I ever need the specific dimensions option with table calculations?” This is a great question! We know that we can utilize the prebuilt options in our table calculation dialog box to choose scope and direction options like table down and pane across.
Luckily, Tableau recently updated its calculation dialog box and made setting the scope and direction of our calculations more flexible than ever! We can use specific dimensions to choose exactly what we want to include in our table calculations.
As per Tableau, what is checked is addressed in the table calculation and what is unchecked is how the table calculation is partitioned. How can we utilize these concepts of addressing and partitioning in a table calculation?
How to See the Whole Pie
Let’s use percent of total as an example. Whenever I teach this calculation, I like my students to imagine that they are creating a pie chart. What is the overall pie chart and what is each slice of the pie? Essentially, that is all addressing and partitioning are. What you check is a slice and what is unchecked is the entire pie.
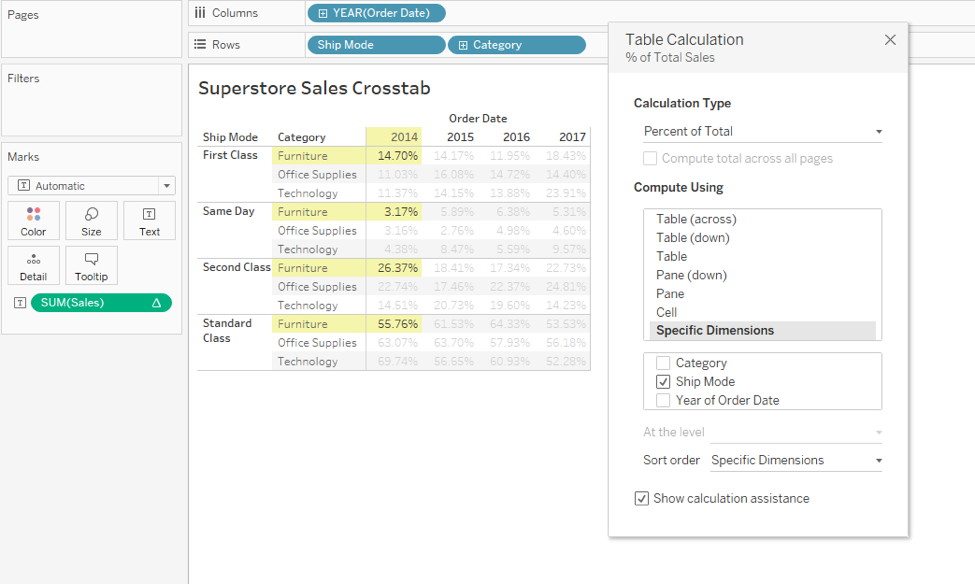
In the Superstore dataset example below, I have Ship Mode checked. I also have Category and Year of Order Date unchecked so I can use these dimensions for partitioning. More simply put, I am seeing what each Ship Mode makes up across that year and category. In the image below, 2014 Furniture Sales would be the entire pie and each Ship Mode is a separate slice:

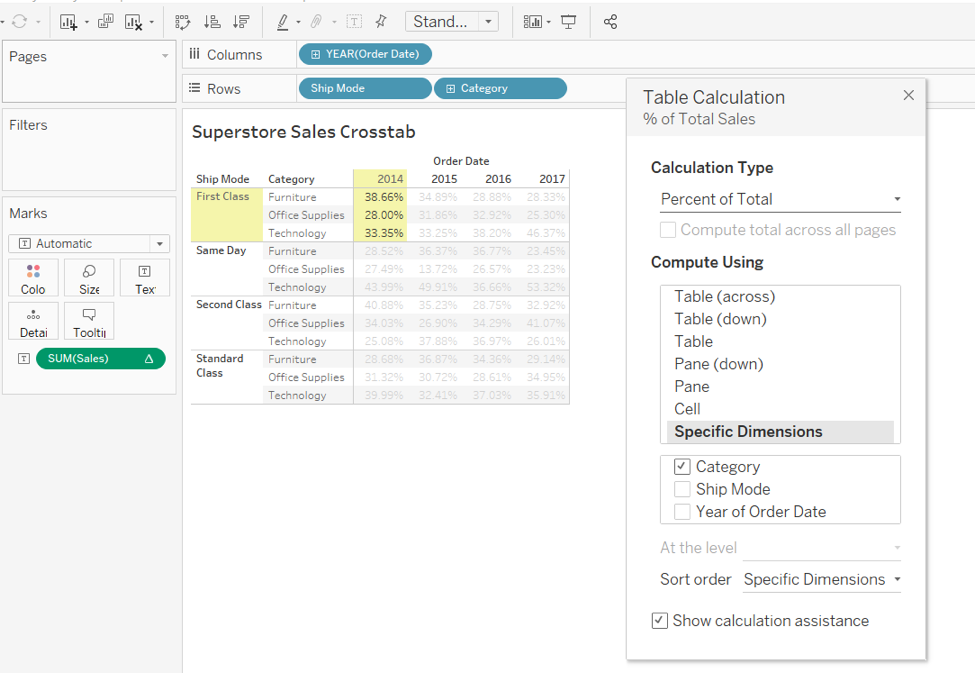
Let’s look at this crosstab in a more visual format: a pie chart. Using the same table calculation, each Category and Year of Order Date become their own pie chart. Each slice is a Ship Mode. Below, If you look at using the Specific Dimensions option of Category as the addressing dimension and Ship Mode and Year of Order Date as the partitioning dimensions, it is identical to using the Pane (down) option:

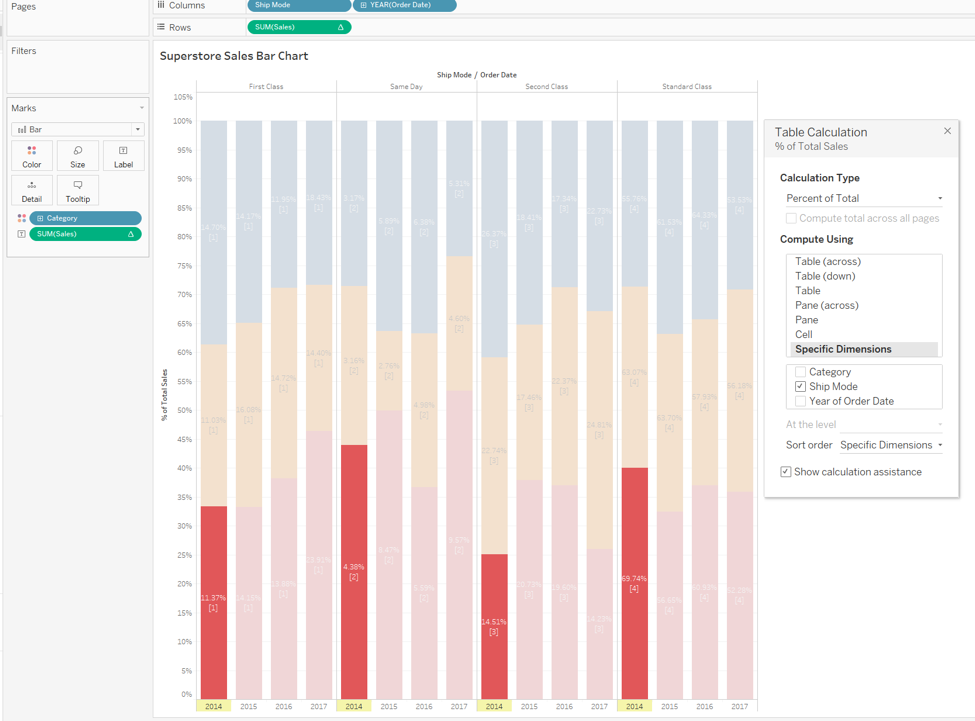
In many of our crosstabs, we can make do with the prebuilt options for scope and direction. However, when we look at more visual charts, like the bar chart below, we can see how using Specific Dimensions can really come in handy:

Using the Specific Dimension options of Ship Mode as our addressing field and Category and Year of Order Date as our partitioning fields, we can get more creative with our table calculation. Here we see which Year of Order Date and Category make up Ship Modes. Since there is no prebuilt option that would allow us to analyze this unique combination of addressing and partitioning dimensions, we must use our Specific Dimensions options.
I encourage you to try using Specific Dimensions for your table calculations, particularly for Percent of Total. This method can provide the precision and granularity to achieve exactly what table calculation you have in mind.

