The Tableau Performance Checklist series is designed to help you streamline your dashboard performance and Tableau Server configuration. Each post expands upon one item listed in the master Tableau Performance Checklist. As of 2024, you can find an updated Tableau Dashboard Performance Checklist here.
The final topic in Filtering addresses when and when not to use user filters and how it can slow down your visualization:
“Don’t be lazy with user filters. Security by user filters can impact performance on Tableau Server as the server cannot share connections and query caches if user filters are active. Consider building a summary view that is a user-agnostic overview using a pre-aggregated extract with underlying data hidden. For a detailed view, restrict it to specific users or active directory groups instead of user filters.“
Let’s jump right in.
Easy Filters
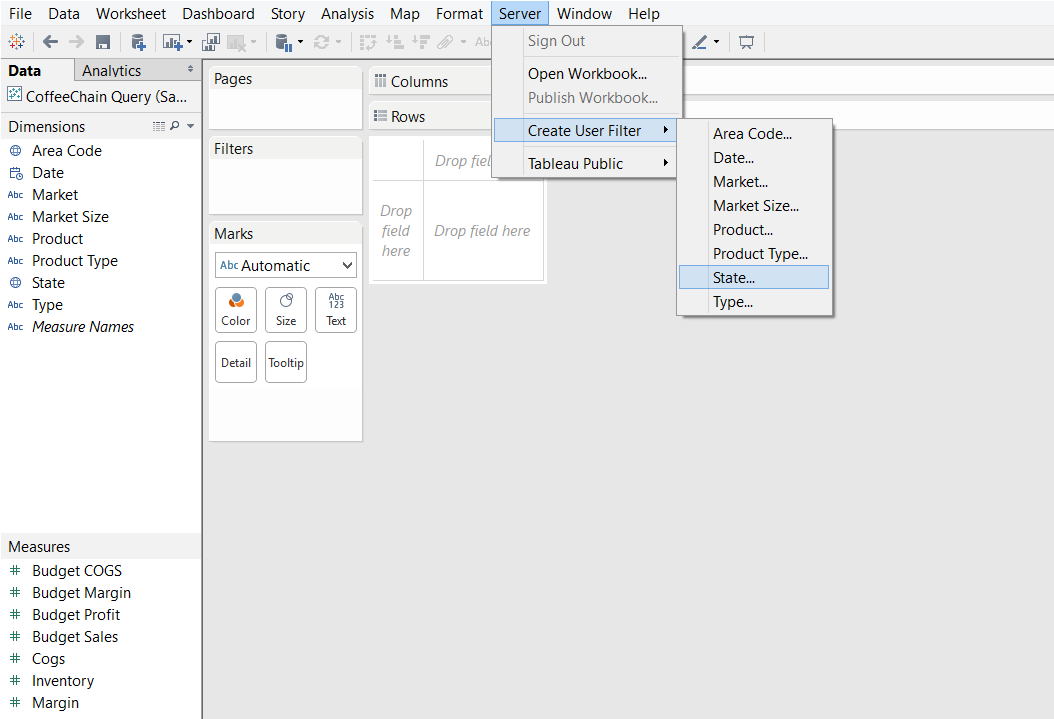
User filters are a way to filter data in your visualizations from Tableau Server based on specific users. For example, if you have a global sales report, you can filter the data that national sales managers see by country. All of this is managed from Tableau Server based on user permissions and logins. You can filter by individual users or groups of users. The specificity of user filters can drill down to the row or column-level.
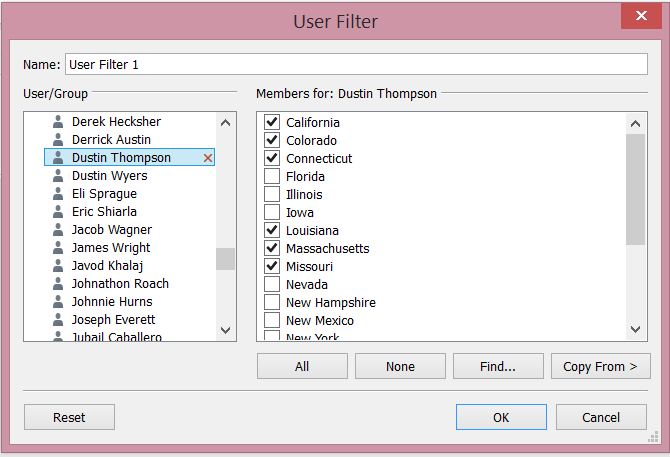
Below is another example, only at the state level:


Big Problems
Implementing user filters impacts the performance of Tableau Server. As stated above in the guideline, utilizing them as convenient security means that Tableau Server cannot share the cache in creating the visualization.
When Tableau creates the view, it creates a query cache that can be quickly reused for other users. User filters force Tableau Server to re-query the database to produce the visualization, essentially recreating all of your affected visualizations and dashboards from scratch for each different group or user that is being filtered via the user filters. Imagine that you’ve got dozens or even hundreds of users controlled by user filters, all of whom are accessing a very complicated and intensive dashboard. You can immediately see how user filters could drastically impact performance.
Efficient Alternatives
In certain situations, we recommend using pre-aggregated extracts that remove the levels of detail that you want protected. This can reduce the number of queries affected by user filters by providing a data source that can be used for higher-level visualizations. Then, only the visualizations that require a finer level of detail would need to be secured via user filters.
That concludes the Filtering category in the Tableau Performance Checklist. Next, we’ll start looking at how to optimize our dashboards by examining how we use custom SQL.
Mastering Best Practices
If you’re interested in becoming a Tableau Server guru, then learning these performance best practices is essential. Check back frequently as we add new posts and dive deeper into each point in the Tableau Performance Checklist.
Another great way to identify best practices is to leverage the insights offered by our Performance Analyzer, part of Workbook Tools for Tableau. It will examine all of your workbooks, worksheets, dashboards and data sources against a list of best practices to ensure that you’re using all the tips and tricks to guarantee your visualizations are moving at light speed.
As always, feel free to get in touch with us if you have any questions regarding performance or anything Tableau related! We’d be happy to help.

