The Tableau Performance Checklist series is designed to help you streamline your dashboard performance and Tableau Server configuration. Each post expands upon one item listed in the master Tableau Performance Checklist. As of 2024, you can find an updated Tableau Dashboard Performance Checklist here.
Who doesn’t love efficiency? We are finishing up with the rendering category today by returning to custom shapes. Let’s get started:
“If using custom shapes, use transparent background PNGs instead of JPGs. Views will render cleaner, and shape files will take up less space.”
Didn’t know we’d get into some Photoshop tips, eh?
Images & Custom Shapes
Generally, when creating symbol maps within Tableau, users select from prebuilt shape pallets. But once in a while, there is a need for custom images to make a graph stand out. It first makes sense to discuss the difference between PNGs and JPGs.
PNG stands for Portable Network Graphics. A PNG is a lossless compression image file, meaning that an image is made smaller without reducing the quality. PNGs are most commonly used for images with sharp contrasting colors, text or graphic lines. PNGs usually have a large file size.
JPG stands for Joint Photographic Experts Group. A JPG is a lossy compressed image file, meaning that an image is made smaller but with a reduced effect to the quality. JPGs are most commonly used for high quality photographs. Generally, JPG files have a smaller file size than PNGs
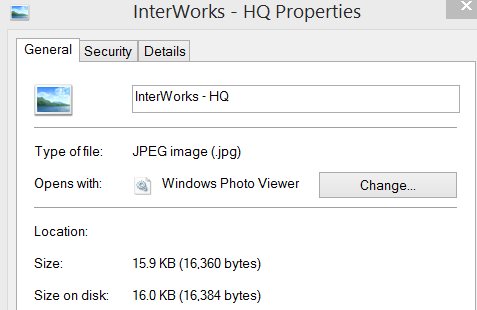
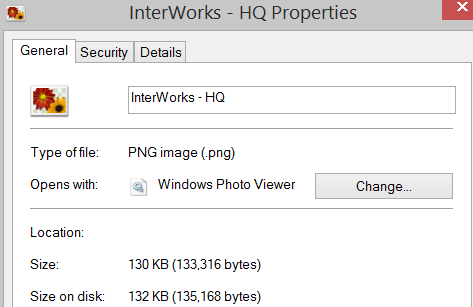
To illustrate the difference, check out these two photographs.
JPG:

PNG:

From first glance, it is nearly impossible to tell the difference. The real difference comes in once you look at the properties and the sizing of the two files.


For custom imaging in Tableau, PNG images have a massive advantage over JPGs because the PNG file type supports a transparent background, which reduces a lot of unnecessary file size. JPGs, however, do not support transparency. Let’s take a look at using a transparent PNG vs regular JPG file for a custom image.

Above is a PNG of the InterWorks logo. There is no white background. This image of the logo can overlay any other graphic seamlessly and still maintain a sharp, clear quality. This is possible by setting an alpha channel. An alpha is a degree of opacity of the pixel which can be altered to select various levels of transparency. This image is 33.7 Kb. The big reason for this is that all of the unnecessary white background has not been included. We covered in our previous article in the Tableau Performance Checklist that the smaller the image size, the better for both loading and exporting.
PNG is also favorable over the older GIF, which also supports transparency. This is because the edges on a PNG image are much cleaner than a GIF. Here are all three varieties on a different colored background to illustrate their differences:
The first image on the left is a JPG (no transparency), the second is our PNG, and the last is the GIF. Pretty big differences in terms of quality and file size.
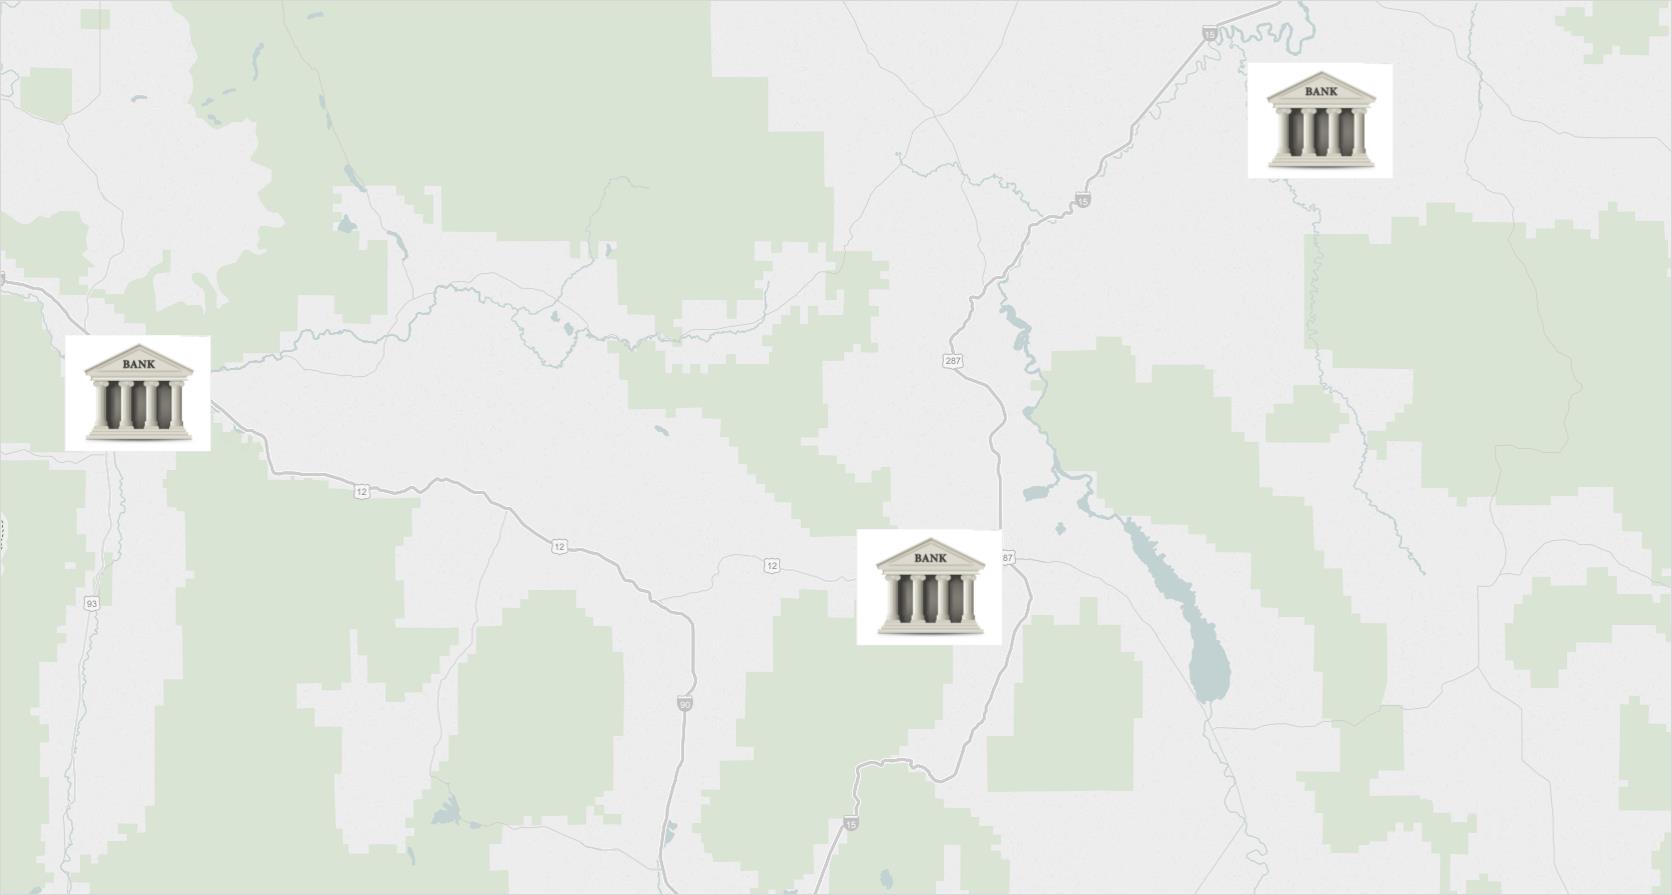
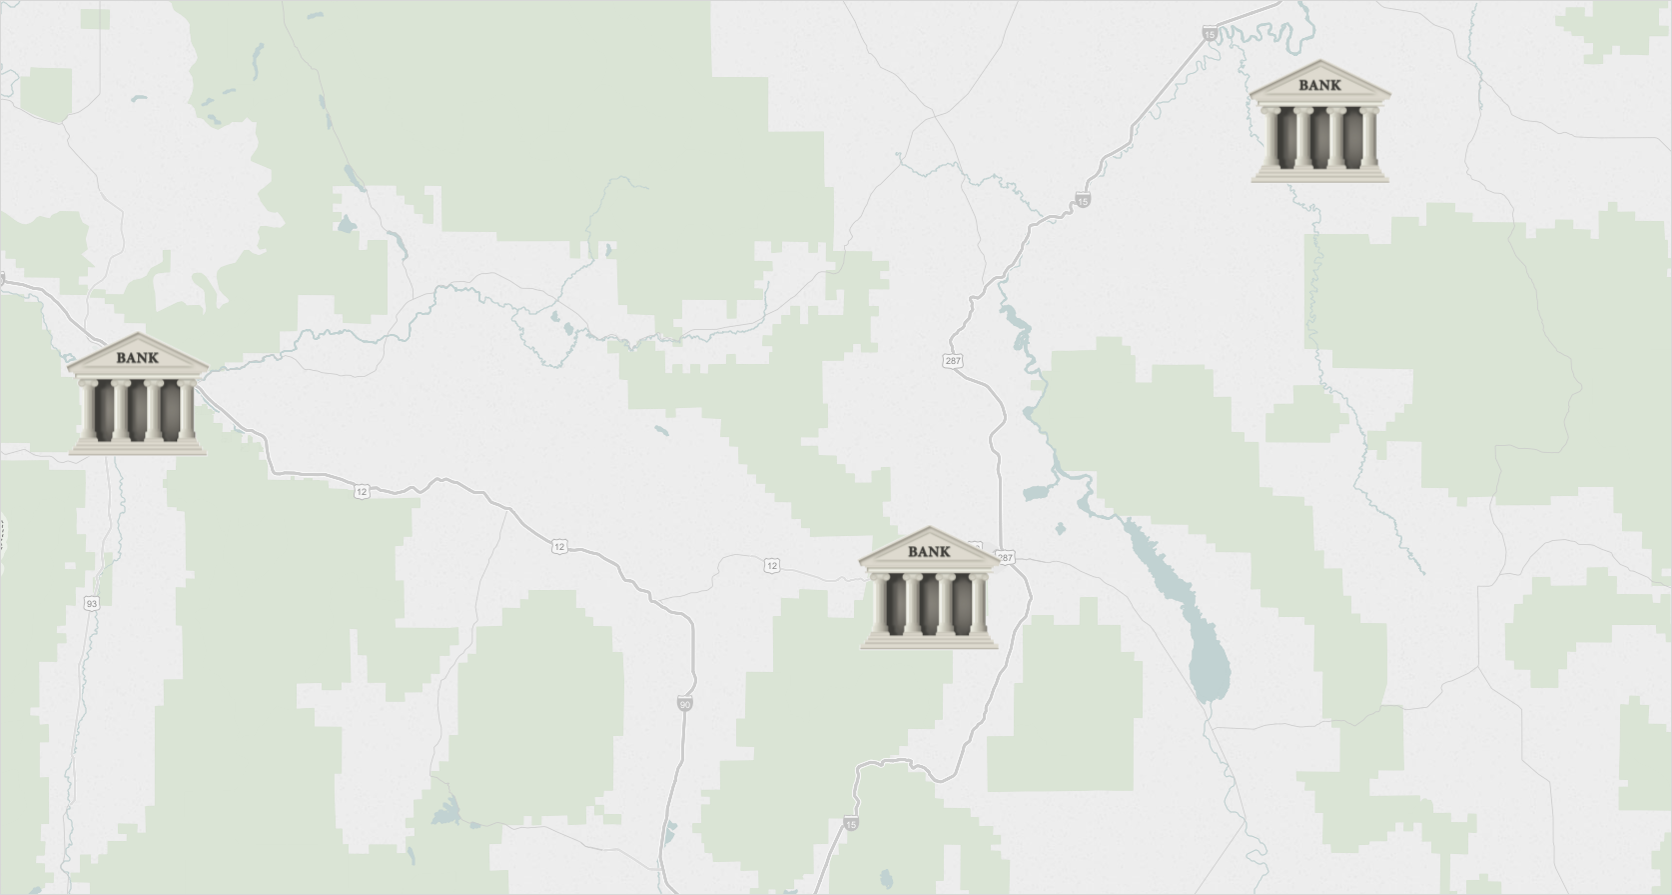
Specifically, in Tableau we can see the different between using a transparent PNG image versus JPG.
JPG images in Tableau:

PNG images in Tableau:

The main difference is the lack of the white background due to transparency.
Mastering Best Practices
If you’re interested in becoming a Tableau Server guru, then learning these performance best practices is essential. Check back frequently as we add new posts and dive deeper into each point in the Tableau Performance Checklist.
Another great way to identify best practices is to leverage the insights offered by our Performance Analyzer, part of Workbook Tools for Tableau. It will examine all of your workbooks, worksheets, dashboards and data sources against a list of best practices to ensure that you’re using all the tips and tricks to guarantee your visualizations are moving at light speed.
As always, feel free to get in touch with us if you have any questions regarding performance or anything Tableau related! We’d be happy to help.

