Our Certified Tableau Trainers are asked a myriad of questions each day. In this series, they share some answers.
“I have sales information about all 50 states, but I only want to see a single state and how it ranks. Sounds like a table calculation, but there’s a catch. Table calculations in Tableau only compute the calculation on data that is in your view. If I filter so I’m only looking at the state I care about, it will have a rank of 1. As exciting as that may look, it is a lie. So how can I make it so that I only see my state and not the 49 I don’t care as much about?”
The answer is a combination of parameters and calculations.
Step 1: Creating a Parameter
Create a parameter that is based on what dimension you are trying to look at. We want to allow the user to select from a list of states, so we need the parameter to include all of them. We could type all of these out, or we can use the parameter creation to get this list from the data itself.
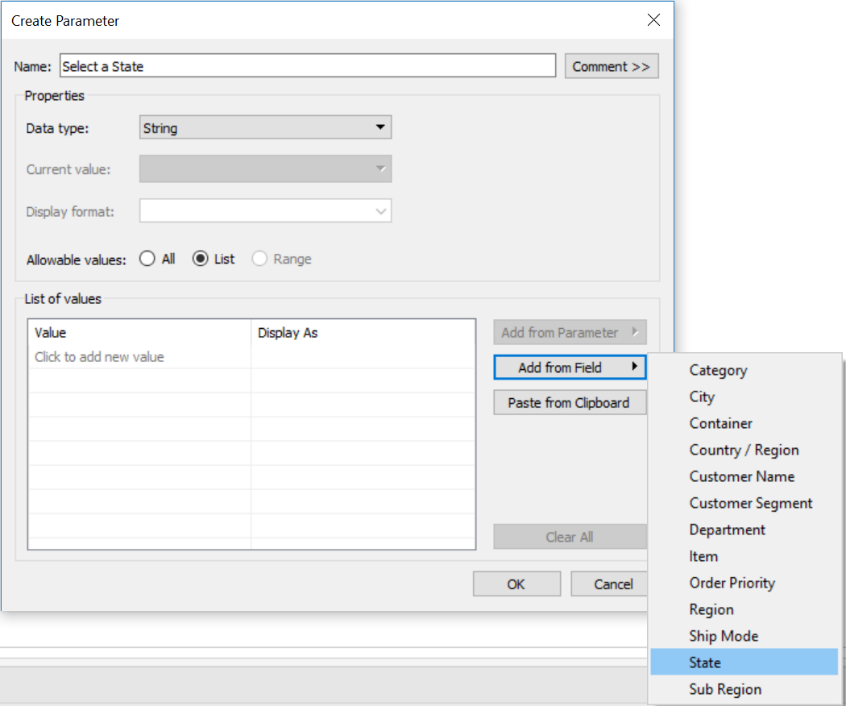
Right-click on the newly created parameter and show the parameter control. Select the State you care about. I’m from North Carolina, so that’s the one I’ll be choosing.
Step 2: Creating a Calculated Field
Create a calculated field that will be true when the parameter is the dimension option you want. For this example, that will be when State is equal to our Select a State parameter:
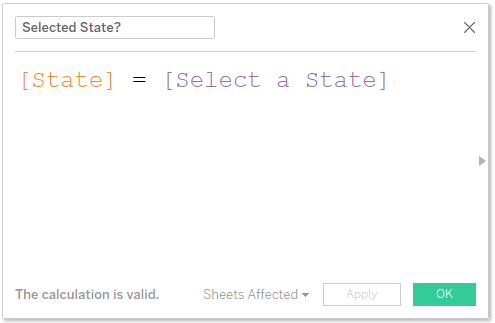
When I’m creating a Boolean calculated field, I like to put a question mark in the name of the field. It’s my helpful reminder that it’s Boolean and what true and false represent.
Step 3: Starting to Create the Visualization
Put your calculated field onto either rows/columns. Next to that, put your dimension field:

We also need to see the rank for each of our states based on the sales. Bring sales into your view, and create a table calculation on it to calculate the rank:
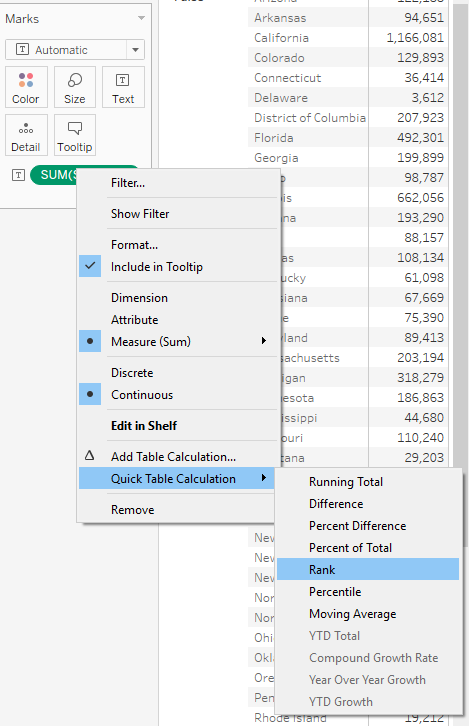
Step 4: Hiding What We Don’t Care About
Doing step 3 should have made it so that your states are divided into two groups: False and True. And lookie there! The State we’re interested in is in the True group, and everything else is in the False group. Let’s get rid of those pesky other states. Right-click on False and select Hide:
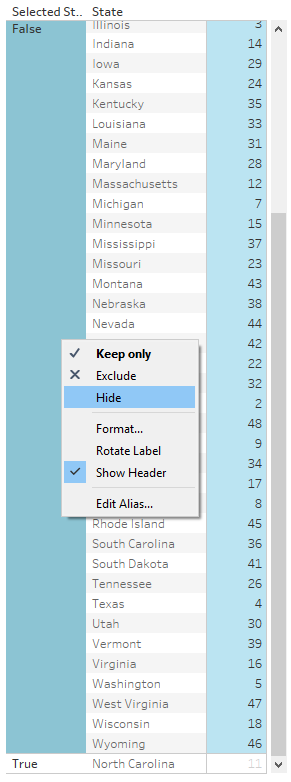
Step 5: Cleaning up the List
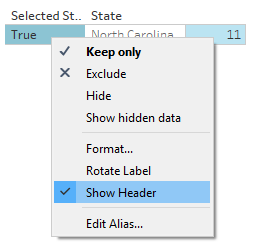
Now that we’ve gotten rid of those other states, we don’t need the True label anymore. Right-click on True and uncheck Show Header:
Step 6: You Did It!
There is no step 6 except to sit back and be proud of yourself. Or change some of the formatting to add a little more pizzazz, such as making the font bigger and adding the state name under the rank, so you can add it to a dashboard. It’s up to you!

Not bad, North Carolina…not bad.

