Tableau Deep Dives are a loose collection of mini-series designed to give you an in-depth look into various features of Tableau Software.
(Note: All the charts we build are included at the bottom of this article in a packaged workbook available for you to download.)
Table calculations in Tableau can get complicated very quickly. But these extra little features make a big difference, such as computing specific dimensions, secondary calculations and more. My goal with this article and the follow-up is to add some use cases for when you’d use the custom sort option in the table calculations editor. In part two, I’ll explore some specific use cases on using custom sorts. First, let’s review how table calculations are sorted.
Table Calculation Sort Basics
When I enable a table calculation on a measure, Tableau offers two basic options. The first is to use the structure of my viz to determine how and where my table calculation is computed. This is defined by scope and direction. Scope is defined in terms of table, pane and cell. Direction is down, across, undefined or a combination of directions (i.e. down then across or across then down).
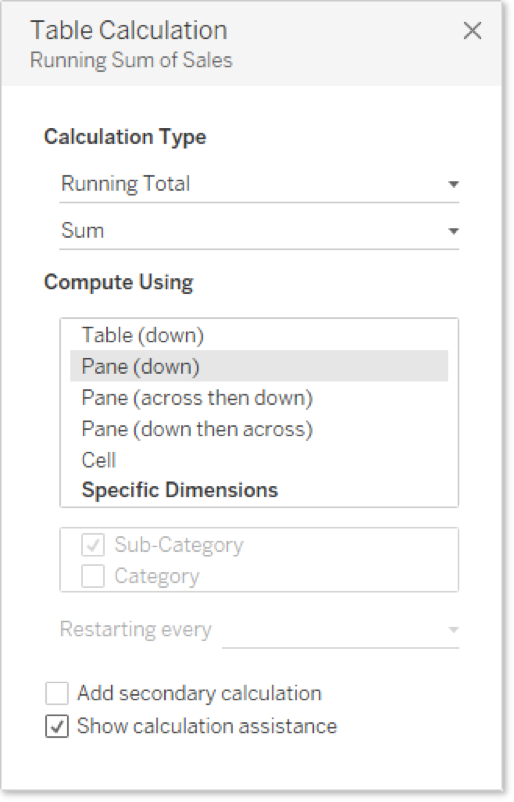
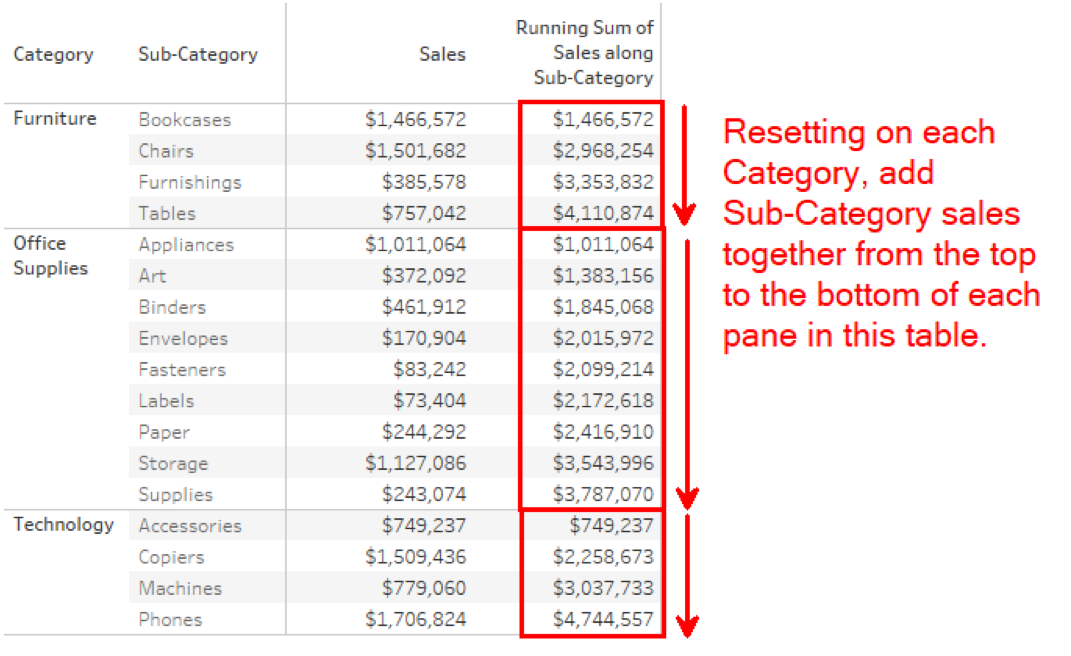
When it comes to table calculations, sorting is not the order in which the rows or columns are displayed. That’s just normal sorting that you do on your table. Instead, sorting within a table calculation is the order in which the table calculation is computed. Let’s look at a calculated running sum below as an example:
Here’s how that table calculation would function on a sample text table:
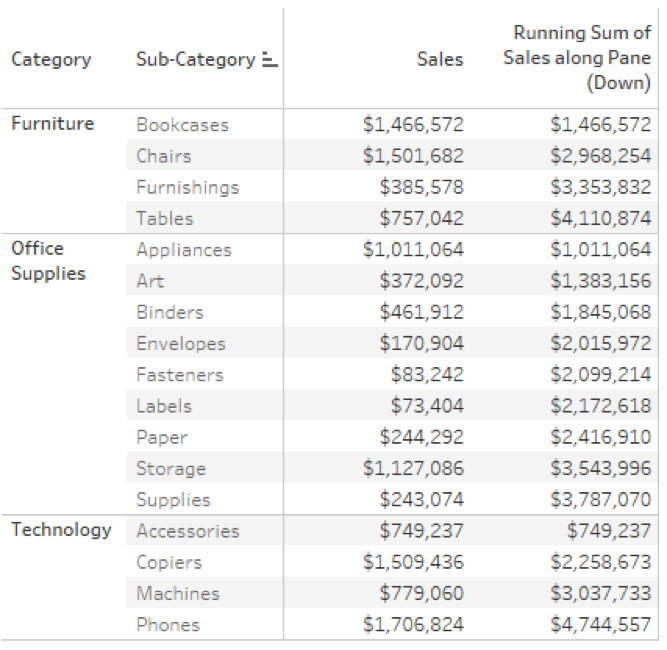
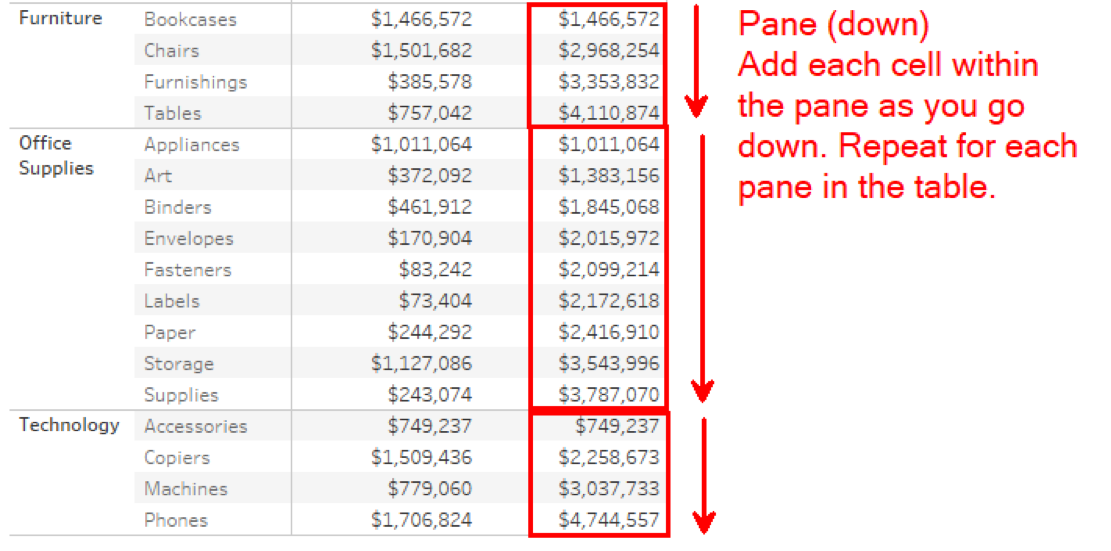
This calculation starts at the top of the pane (or category) and works its way down row by row, adding the next number to a growing sum. This is how Tableau computes this calculation:
Sorting with Specific Dimensions
The second table calculation option is to use specific dimensions within the visualization to determine how the calculation is computed, rather than the chart structure. This has replaced the old addressing and partitioning function from Tableau 10’s pre-version. Let’s continue with the example above where I was using pane (down). Recreate the exact same computation, but use specific dimensions to do it:
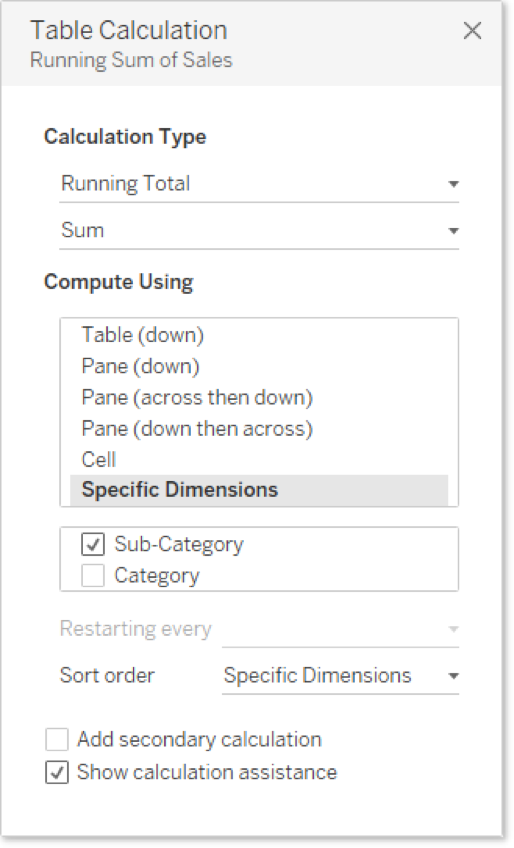
Our result is the same, but here’s how it changes what Tableau is doing behind the scenes to compute this calculation:
See the difference? In the first example, Tableau is using the structure of the table to organize the table calculation. In the second, Tableau is looking at the dimensions in the table. This is a crucial difference because it unlocks a lot of cool use cases that we can use with our table calculations. A perfect example of that expanded functionality is custom sorting.
Custom Sorts
Custom sorts appear in the table calculation editor when the Compute Using menu is changed to specific dimensions. Custom sorting is available on all types of calculations except rank and percentile. In example two, I used specific dimensions. Tableau used a default sort order to organize this computation. It started the running sum at the top and continued down each sub-category until we hit a new category.
Because sub-category is sorted by ascending order, the table calculation happened to be in ascending order as well. Custom sorts allow me to completely change that order of computation. Let’s do the exact same computation above, but this time I’ll show you how it would look as a custom sort:
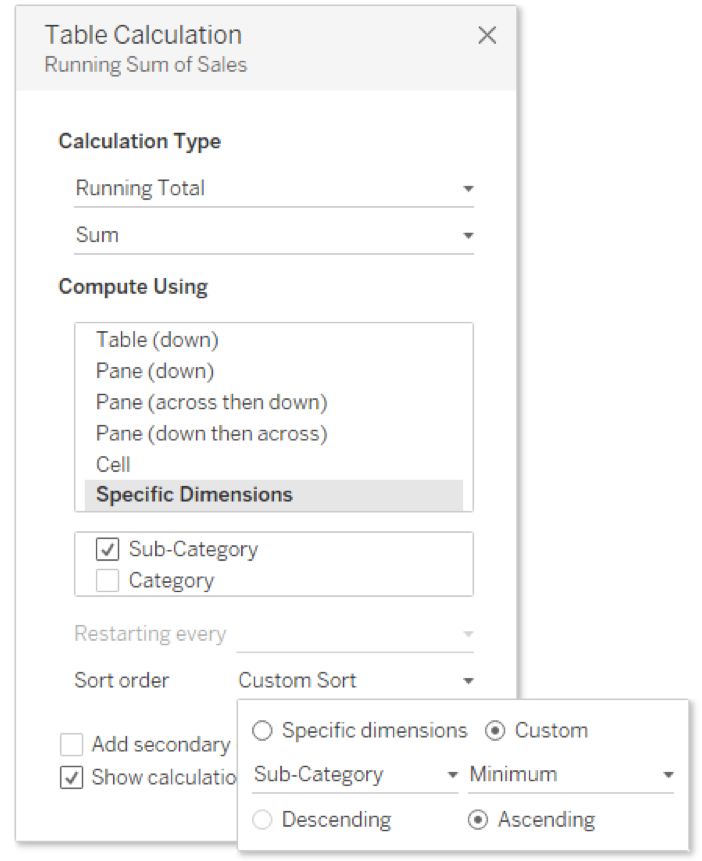
I’m telling Tableau to use sub-category in ascending order. In other words, we are starting alphabetically on sub-category and then adding each subsequent value until we reach a new category. The MIN() function in this example is to satisfy a requirement for matching levels of aggregation.
What happens if I change ascending to descending? Then I would start at the lowest letter of the alphabet within sub-category and work towards the highest. With my sub-category still sorted in ascending order, I’ve effectively changed my scope and direction to pane (up). Take a look at what we changed:

And the change gives you this:
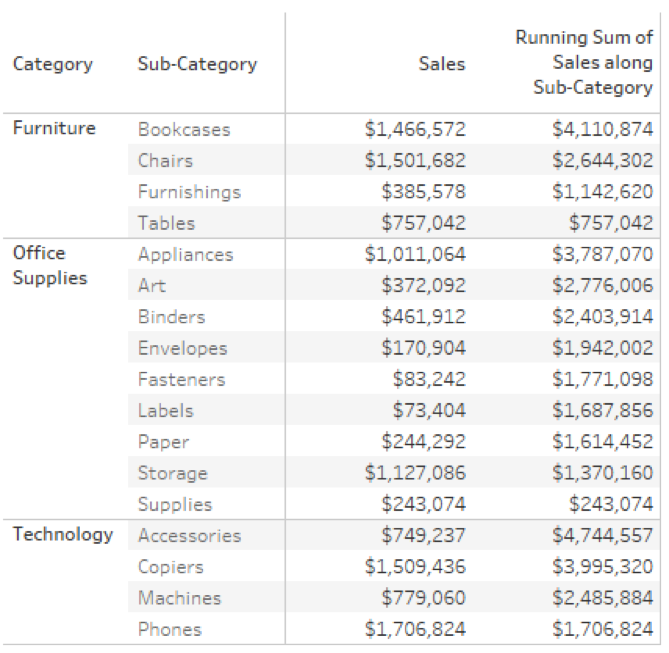
This calculation starts with the sub-category that is lowest in the alphabet and works its way back towards the top (i.e. A). If I decide my sub-category rows should be in descending order, so that tables is at the top of the furniture category, my table calculation still sorts in descending order. What if I change my custom sort to sort on a different field? How about sales? Remember, I need to choose an aggregation, so let’s choose SUM():
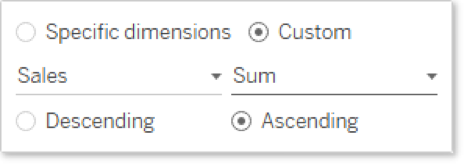
Tableau is going to start with the lowest value of sales within each category and then add the next lowest sales as it moves sub-category by sub-category through each category in the table.

Download all the work we have done in this TWBX file.
What’s Next?
You can see how this opens a new world of options in how we organize and customize our table calculations. In part two, I’ll apply this feature to two different use cases to do some really neat stuff using the Index() function and another with a Running Sum () across different levels of detail. Please drop any comments you have in the space below. Cheers!

