
Tableau Deep Dives are a loose collection of mini-series designed to give you an in-depth look into various features of Tableau Software.
The ultimate goal of this Deep Dive on Dashboard Design is to guide Tableau Desktop users on how to create a dashboard from start to finish. That conversation would not be complete unless we went the extra mile. I’m talking about publishing the dashboard of course. We’ll also continue the second half of our governance conversation as part of this discussion.
I’m going to break with the standard format of this series and instead present some concepts and then revisit them as a practicum. I’m going to divide this article in two sections – Governance and Deployment (Tableau Server and Tableau Public).
Governance
Be sure to check out the first part on this topic in the previous Deep Dive article, Optimization & Governance. In that article, we explored steps #1 – validation, #2 – performance and #3 – documentation. We’re now ready to cover standardization and pre-deployment preparation.
#4 – Apply Brand Standards
With a lot of different people using Tableau Desktop across your organization, it is inevitable that different styles pop up among individuals, teams and departments. That might be fine internally, but when that dashboard starts to see other stakeholders, consistency grows in importance.
Most organizations have brand standards that are rigorously maintained across all marketing collateral and communication materials. The same should be applied to analytics.
InterWorks has several tools inside Power Tools for Tableau: Desktop to help here. The first is a free online tool called the Color Tool. This allows you to create a custom color palette that can then be shared with other users as a Tableau Preferences file or TPS. Sharing a palette using acceptable colors can help with some of the back-end changes that might have to be done across multiple dashboards at once.
The other tool is the Style Management tool. Tableau Desktop gives its users an incredible amount of control and specificity in working with style, fonts and formats. The Style Management tool gives you this same level of control, applicable across several dashboards at once. If you have to make stylistic changes across workbooks, then the Style Management tool is the easiest way to do it.
The only caveat here is that you have full control over all the formatting elements available in Tableau Desktop, so it takes a bit of practice to understand which settings apply where and so forth. Always make sure to visually check your dashboards after using the Style Management tool to ensure the changes you made were ones you wanted.
#5 – Tag for Deployment
In the deployment cycle that I’ll detail below, our Tableau Server is distributed across different environments. Each environment represents a different level in our governance cycle or stage of validation. Those stages might be TEST, DEV and PROD for instance. We never want to publish directly into production. There is a chain of validation that moves our dashboards along as they are checked and rechecked before being officially optimized.
When a workbook is ready for the next step of the governance process, I recommend adding a tag to signal the project or site admin to move it to the next location. In other words, adding the “Go” code to a workbook ready to graduate from one environment to the next. This lets our administrator know what stage of validation this workbook has completed and has yet to do.
Tags are keywords that can be added to workbooks, also called metadata. Adding Tags is done when publishing to Tableau Server or within another Power Tools goodie that we’ve created, which we’ll talk about more below.
Deployment
Let’s look at publishing our workbook within Tableau Server as well as publishing directly to Tableau Public.
Publish to Tableau Server
Let’s assume at this point our dashboard has remained on our local machine during the entire design process. It’s now time to move it to Tableau Server. To do this, you’ll need your organization’s Tableau Server credentials. Consult your Tableau Administrator for more information on your login details as well as your access and privileges within Tableau Server.
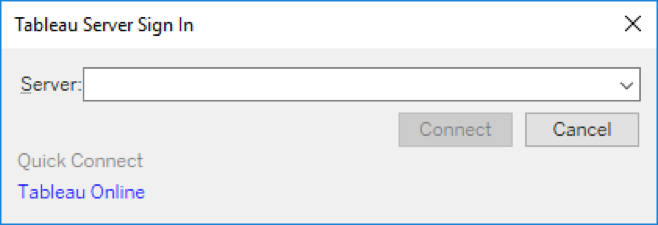
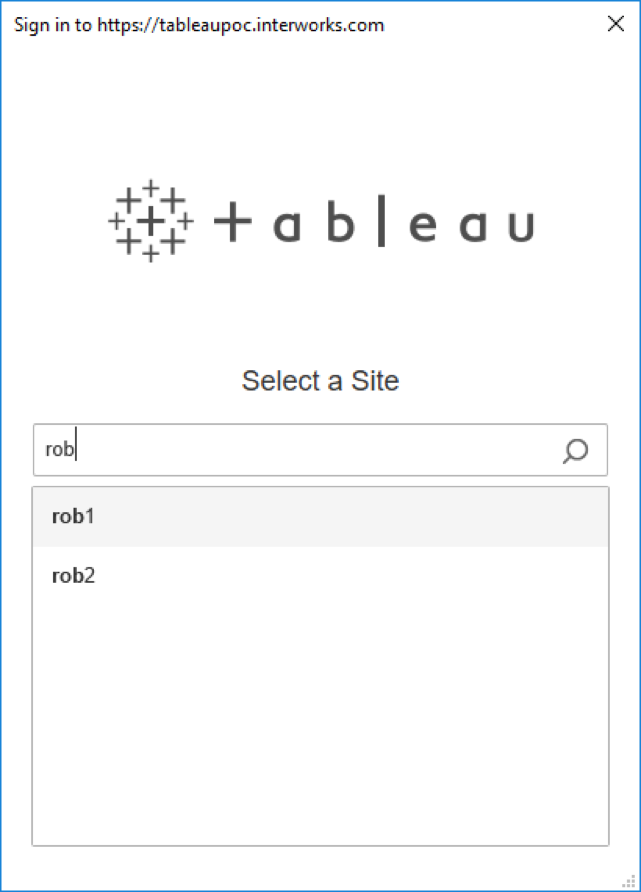
To publish your workbook to Tableau Server, start with the Server drop down menu and select Publish Workbook. You’ll then be prompted to select a site to publish to, like in the image below
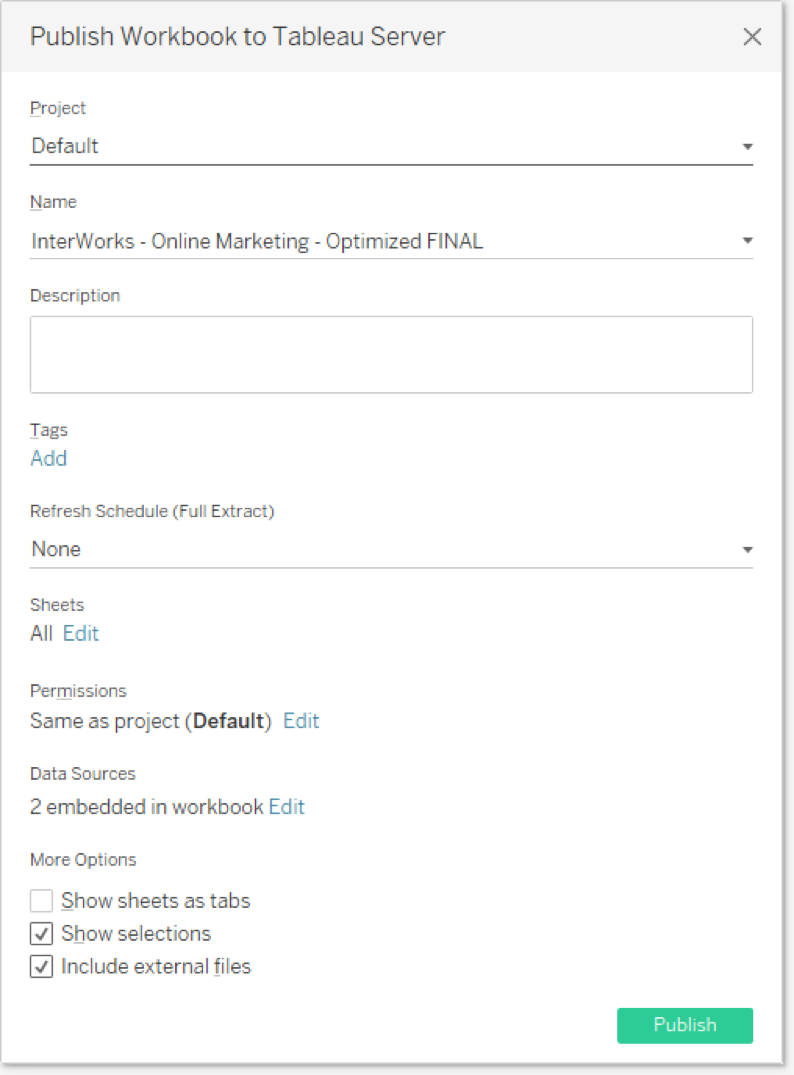
Then complete the remaining details: project, name, description, tags, refresh schedule, sheets, permissions, etc.
Advanced Deployment
Publishing a single workbook from Tableau Desktop to Tableau Server is relatively painless. But let’s take it to the next level. How about we move 50 workbooks from the TEST environment to DEV. It’s not as easy and certain design decisions from your dashboards can make this even more tedious.
For instance, let’s say that your dashboards are connected to TEST data sources and need to be reconnected to a new data source in the new environment. Or perhaps there are parameters or URL actions that have to be updated. Or let’s say that old tags must be removed (i.e. “Ready for DEV”) and/or replaced with new tags (i.e. “Ready for PROD”).
The good news is that Power Tools for Tableau: Deployment can manage all of that. Our consultants ran into the exact same problems that you’re experiencing, which became the genesis of the Deployment tool. The tool creates a reusable and customizable deployment plan.
The plan allows for workbook mapping, transformations, dynamic selection, tagging, archiving and even rollback for bad deployments. The plan also allows for the deployment and management of published data sources and extracts as well.
Let’s assume that we have a batch of 10 workbooks in our DEV environment that are now ready to go to PROD. Whoever oversees vetting the workbooks at this stage (a team lead, project admin, site admin, etc.) has dutifully gone through all the checks: validating the build, testing performance, documenting and applying consistent brand standards.
At this point, each workbook can be assigned a new tag, such as “Go to PROD” or whatever designation makes sense. Using the Deployment tool and dynamic selection based on this tag, they can now be added automatically into the next batch for deployment manually or scripted as a scheduled deployment during off-peak hours.
As soon as Deployment is completed, a new series of tasks is performed. Tasks such as scheduling extract refreshes, alerting report consumers to the new or updated dashboards, adding in data-driven alerts and more.
Publish to Tableau Public
Tableau Public is a free alternative to Tableau Server (or Tableau Online). It is available on an “as is” basis for people to publicly share their visualizations with the other members of the Tableau community.
Each person is given 10GB of online storage space. Most Tableau Public workbooks are available for download by the other community members just to check out all the cool stuff happening inside, but you can disable that feature if required. It’s a great way to make a name for yourself in the Tableau community as well as showcasing your skills to potential employers.
There are a couple of requirements for Tableau Public.
- You must create a Tableau Public account prior to publishing. This is different from a Tableau Community account.
- Your data sources must be saved as extracts. No live connections. Tableau Desktop will prompt you to create an extract if you haven’t already and if you attempt to publish to Tableau Public.
- Your dashboard must abide by the terms of use for Tableau Public.
To publish to Tableau Public, go to the Server drop down menu and select Tableau Public at the bottom.
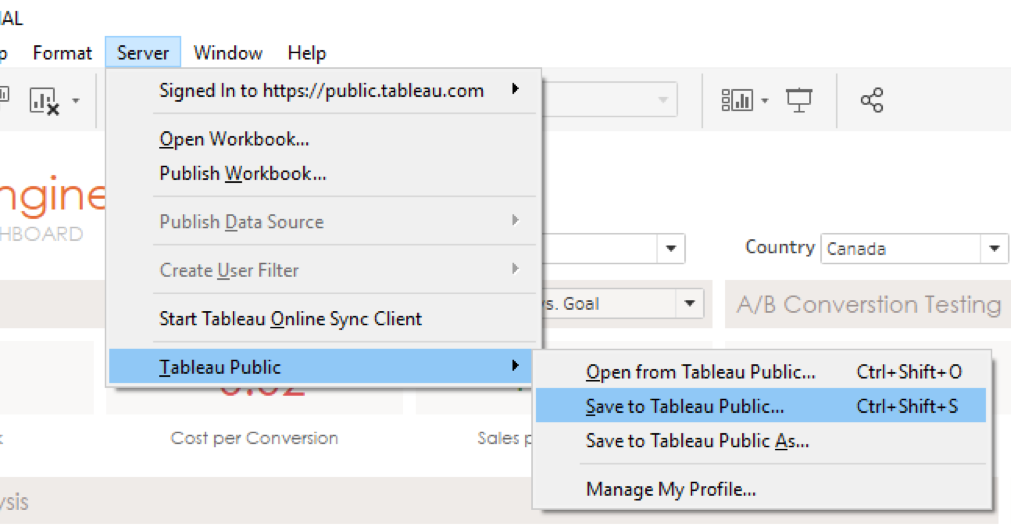
You will be prompted to sign in if you haven’t already:
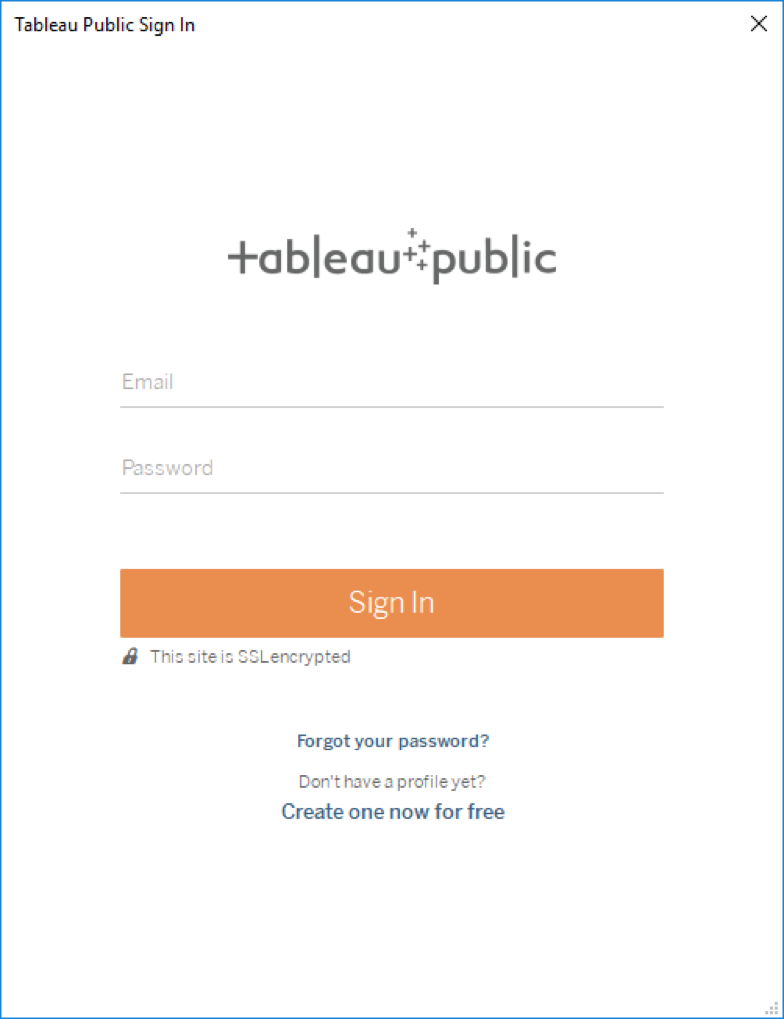
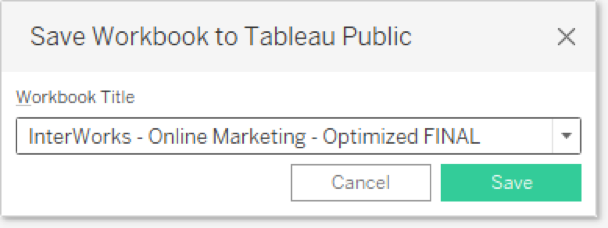
Once you’ve connected to Tableau Public, simply name your dashboard and Tableau will take care of the rest.
You can now share your dashboard with anyone and even embed it into web pages, just as I’ve done for the entirety of this Deep Dive series.
Mission Accomplished
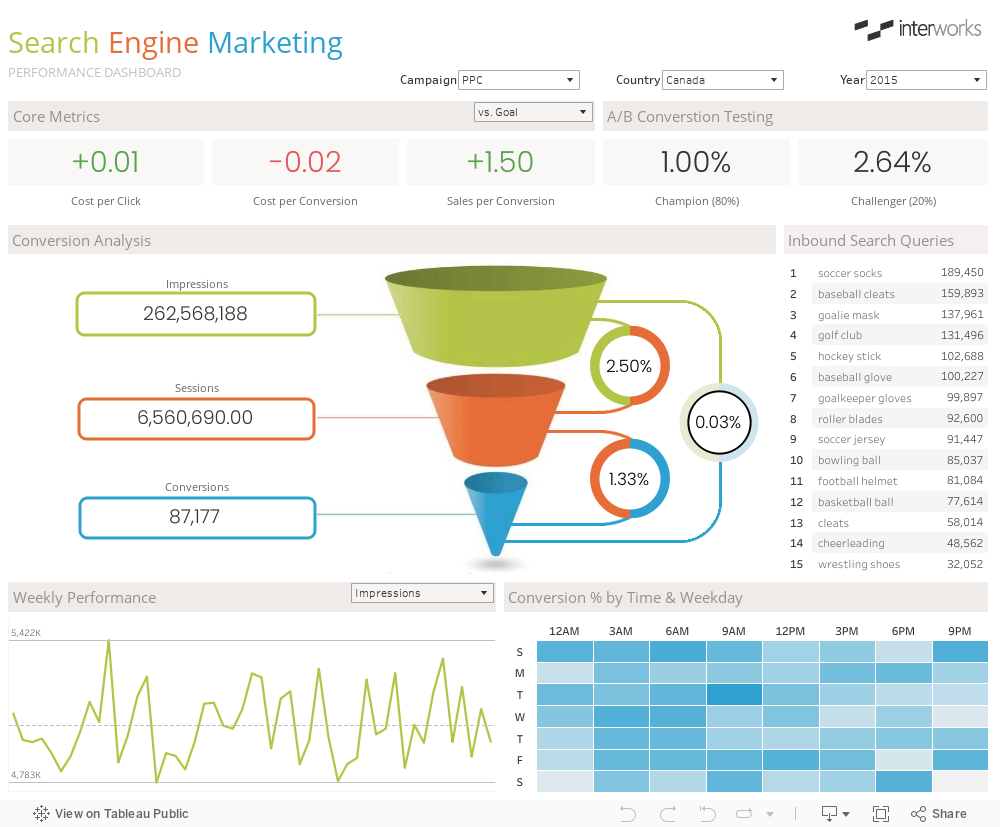
We did it! Starting with a bare bones idea, we’ve now completed each step in the dashboard design process. Below is our finished dashboard posted on Tableau Public.
I hope you found this Deep Dive as helpful as it was fun for me to write. Please let me know if you have any thoughts or questions in the comments section below. As always, InterWorks is here to help with any Tableau, data or BI questions you might have in the United States, Europe, Asia and Australia.
Thanks for reading!