
The Tableau Performance Checklist series is designed to help you streamline your dashboard performance and Tableau Server configuration. Each post expands upon one item listed in the master Tableau Performance Checklist. As of 2024, you can find an updated Tableau Dashboard Performance Checklist here.
This post is on how to make use of TDS files to easily share metadata about a data source with others. We will be digging into the fifth point in the data section of the Tableau Performance Checklist:
“Create a published TDS file for your business team to use rather than each analyst creating their own data source. This includes all metadata associated with dimensions, measures, calculated fields, hierarchies, sets, parameters and naming conventions.”
TDS files save time and avoid confusion by allowing you to set up the metadata so users can get straight to building visualizations. Just in case this is a new term to you, metadata is a fancy way to say “data about data.” So, the metadata for a sales variable in a data set could be things like measure, continuous, number with decimals, currency with units shown in thousands and default aggregation set to sum.
Tableau does a great job of taking care of most of this work for us automatically, such as assigning variables to dimensions or measures and selecting a data type such as geographic or date, but it can only go so far. If the variables in a data set are labeled with abbreviations that not all users will understand, it is best if we rename the variables and add a detailed comment for other users in a TDS file rather than leave them to make a best guess.
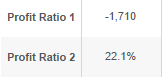
Having calculated fields already in place is also very helpful to save time spent recreating calculated fields and making sure everyone is using the same calculations. For example, the following calculations for Profit Ratio in the Superstore data set are similar but yield very different results:
|
SUM([Profit]/[Sales]) SUM([Profit])/SUM([Sales]) |
 |
You can create a TDS file from an existing workbook where you have already added in all of the formatting and calculated fields needed or you can start from scratch and prep a data source for others. Below is a review of the many things covered by the metadata saved in a TDS file, which you can see by right-clicking on a variable in the Data window:
- Rename Variable
- Group variables into folders
- Hierarchies
- Calculated Fields
- Groups
- Sets
- Parameters (Note: A TDS file will only save a parameter if it is referenced by a calculated field)
- Dimension or Measure
- Discrete or Continuous
- Data Type
- Geographical Role
- Default Properties (This includes comments, color, number formats, aggregation and totals)
Creating a TDS/TDSX
When you create a TDS file, you will also have the option to create a TDSX. A TDS file tells Tableau how to use the data once it is pulled into Tableau and will include the file path to find where the data is located locally, be it an extract or an Excel file.
A TDSX file will create a zipped file which includes an extract of the data along with the metadata on how that data should be displayed in Tableau. If your users have local access to the data, just create a TDS file to avoid creating multiple copies of the same data source.
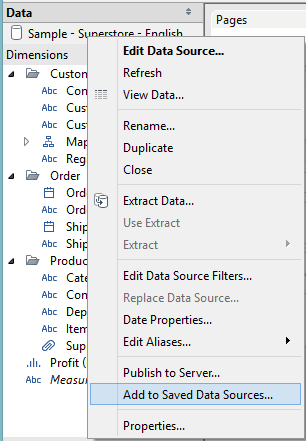
Below are screen shots of two ways you can go about creating a TDS file in Tableau Desktop. The first option is to right-click on the data source in the Data window and select Add to Saved Data Sources… Then, choose the name, save location and decide if the file type should be TDS or TDSX.
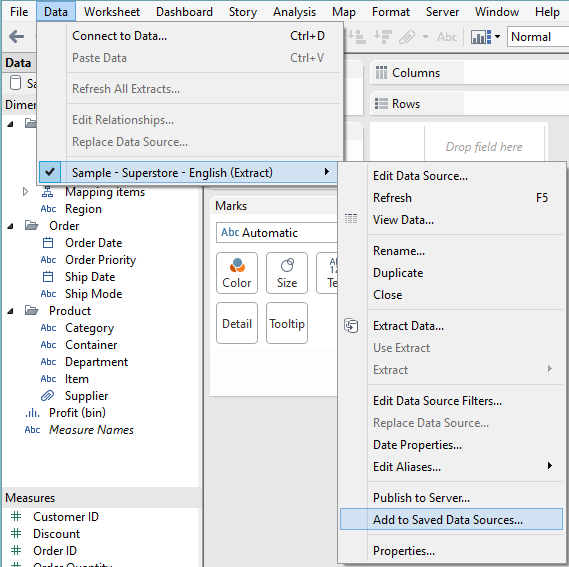
The other option is to go under Data in the toolbar, select the data source and select Add to Saved Data Sources… Proceed to choose the name, save location and file type.
Option 1
Option 2
Mastering Best Practices
If you’re interested in becoming a Tableau Server guru, then learning these performance best practices is essential. Check back frequently as we add new posts and dive deeper into each point in the Tableau Performance Checklist.
Another great way to identify best practices is to leverage the insights offered by our Performance Analyzer, part of Workbook Tools for Tableau. It will examine all of your workbooks, worksheets, dashboards and data sources against a list of best practices to ensure that you’re using all the tips and tricks to guarantee your visualizations are moving at light speed.
As always, feel free to get in touch with us if you have any questions regarding performance or anything Tableau related! We’d be happy to help.