Questions from Tableau Training: Can a Top N Parameter be Nested Within Other Fields?

Data

Questions from Tableau Training: Can a Top N Parameter be Nested Within Other Fields?

by Jon Bajon
//

Our Certified Tableau Trainers are asked a myriad of questions each day. In this series, they share some answers.

The latest question from Tableau Training comes from Ryan, who was in a DII: Intermediate course in New York City.

“I know I can show top n products with a parameter, but how can I get the top n products nested within other fields?”

This is a great example of expanding the knowledge of what we learn in class to practical business scenarios. Let’s get to it!

We’ve discussed the basics of parameters quite a few times within the QFTT series, so we’ll jump right to the good stuff to answer Ryan’s question.

The Setup

Using the Sample – Superstore data set that ships with Tableau, let’s set the stage with a simple view. Dragging Ship Mode and Product Name to Rows and Sales to Columns and sorting by descending sum of Sales to generate the view below:

Ship Mode & Product Name view

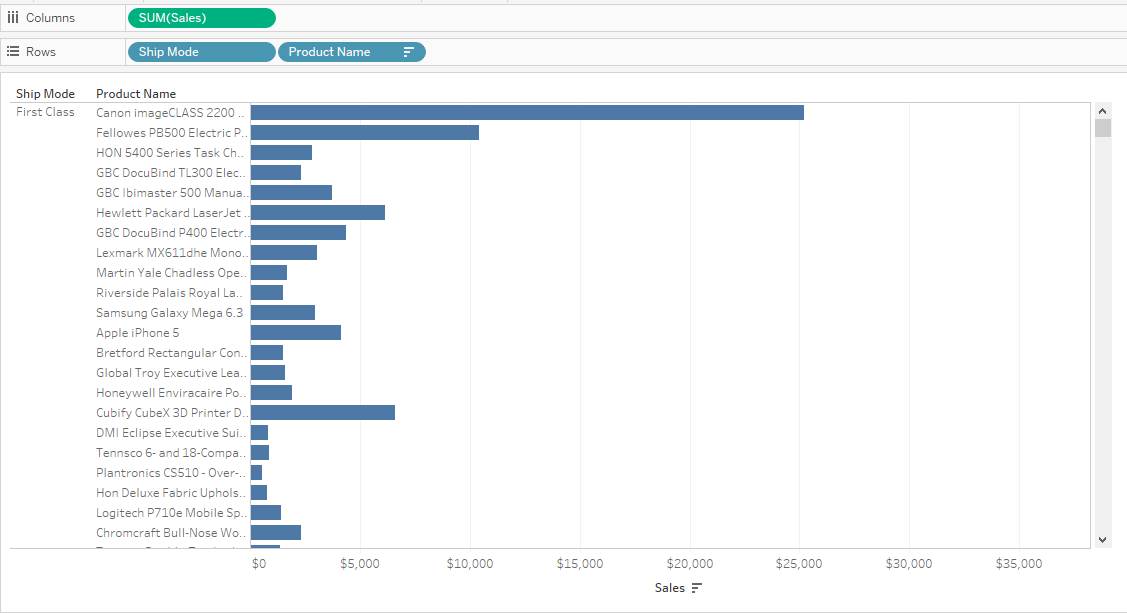
Above: Product Name sorted by overall sum of Sales.

Notice that the even with the descending sort, our Product Names still seem out of order. That’s because by default, Tableau is sorting overall, ignoring Ship Mode completely. If we want to consider Ship Mode in the sort, we can use a helper function (a.k.a. table calculation) to do it. Using an extra copy of Sales, I created a rank table calculation that uses Pane (down) as the direction. Finally, switching the field from continuous to discrete allows us to use the field on rows between Ship Mode and Product Name.

Create Rank table calculation

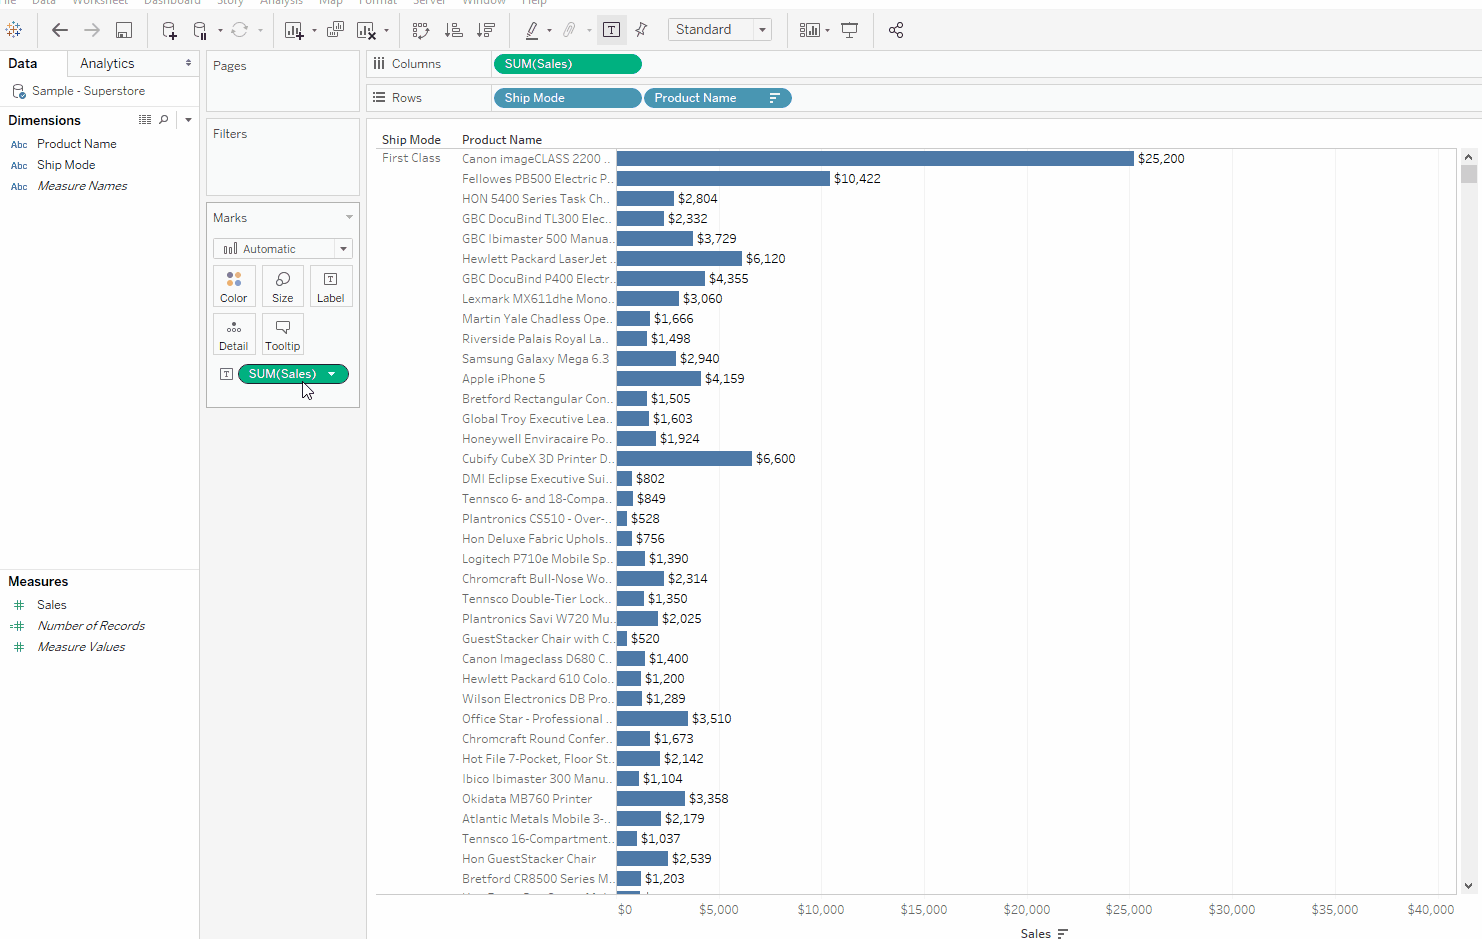
Above: Switching the field to discrete forces it to produce a header with labels rather than an axis, which cannot split other headers and labels.

For a finishing touch, we can right-click on the Sales table calculation we just placed on rows and uncheck Show Header, that way we are just left with correctly sorted:

Correctly sorted view

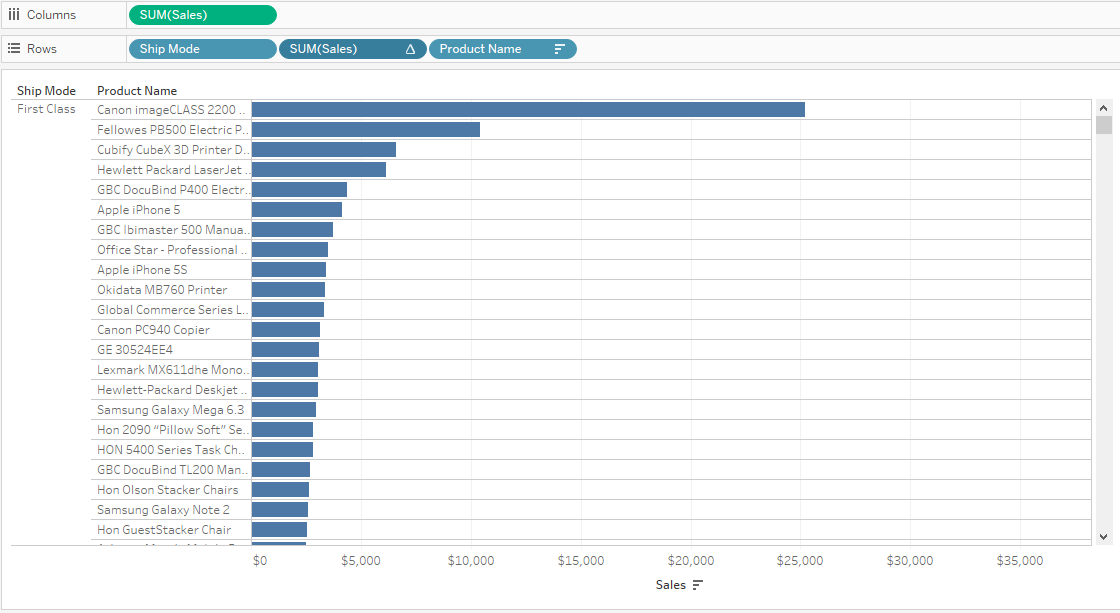
Above: Clean and sorted. Ready for showing top N.

We could then filter by our Sales table calculation to create a static sort. Which brings us to the question Ryan asked: How can we make this dynamic?

The Calculations

By harnessing the power of calculated fields and parameters, we can make quick work of Ryan’s question. Let’s start by creating a parameter.

By right-clicking some white space in my data pane, I’m able to access the create a parameter option. With my parameter menu opened, I named my parameter Choose Top N and selected integer as my data type. Choosing range as my allowable values, I set my minimum to five and maximum to 25 as a starting point. Don’t forget to show your parameter control!

Create Parameter

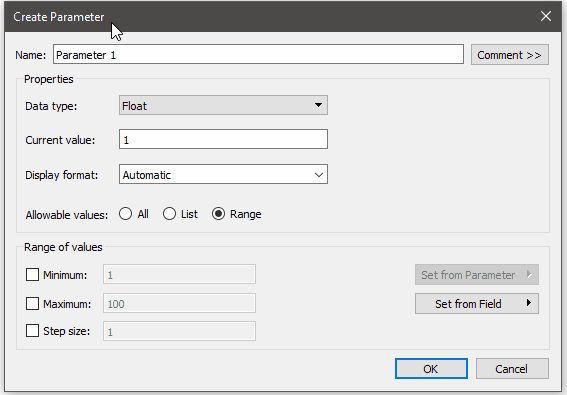
Above: Feel free to change the minimum and the maximum to more relevant numbers for your own scenario.

Creating the parameter is just the first step in this process. You’ll notice that as you move the slider on your parameter control, nothing happens to your visual. This is because the parameter isn’t tied to the visual in any way. To link the two, we need to create a calculated field.

Similar to how we created the parameter, right click in the white space of the data pane and create a new calculated field. I called my calculation <= Top N and typed the formula below. This calculation will compare the rank of Sales with the number set by the parameter and return either true or false.

Choose Top N calculation

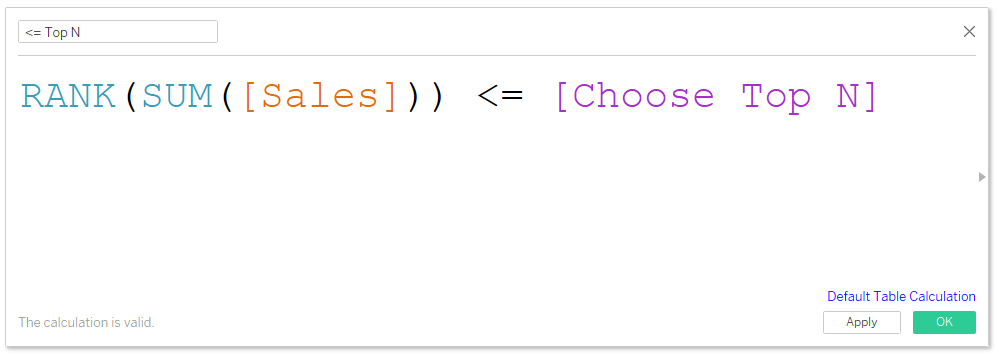
Above: Feel free to ctrl + drag the sum of Sales table calculation field to the calculated field editor to automatically display RANK(SUM([Sales])).

The Visual

Next, drag your new boolean calculation to the filters shelf and check the box for True. The logic here is we only want Tableau to display values where the rank is less than or equal to what we enter for the parameter. If our parameter is set to five, we should get something like the visual below:

View with boolean calculation

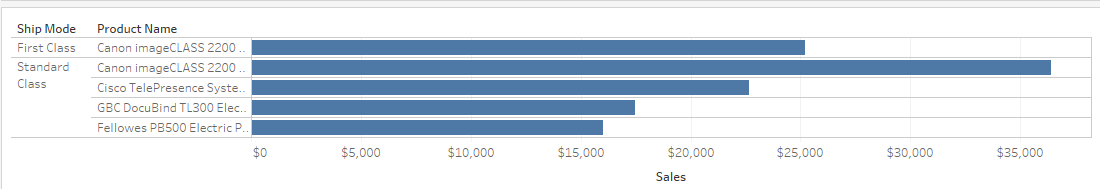
Above: We seem to be missing something here … what could it be?

Notice that we only get a total of five values. That’s far off from our goal of showing five Product Names for each Ship Mode. If you were paying close attention, you might have noticed that our previous calculation was a table calculation by default. Because it’s a table calculation, we can change the direction to restart the count after each Ship Mode defined as Pane (down). You may have to choose True again for the filter. A quick change gives us what we were looking for and answers our question:

Final Tableau view

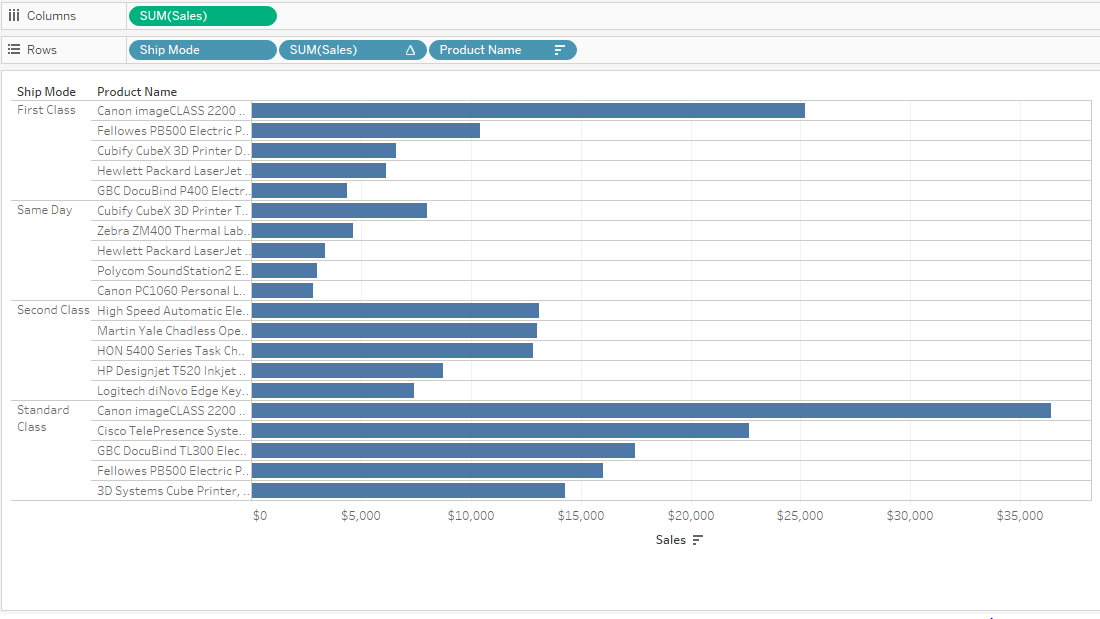
Above: Looking good! Change the parameter to see the different results.

Great work! Now we have a dynamic nested top N visual that we can amaze our peers with at the next team meeting. Thanks again to Ryan for the awesome question!

Want More Questions from Tableau Training

  1. Questions from Tableau Training: Quick Filter Interaction
  2. Questions from Tableau Training: Labeling with Table Calculations
  3. Questions from Tableau Training: Speeding Up Presentation Views when Using Tableau
  4. Questions from Tableau Training: Dashboard Actions
  5. Questions from Tableau Training: Business Day Calculations
  6. Questions from Tableau Training: Adding Gaps Between Bars
  7. Questions from Tableau Training: When to Pivot Data in Tableau
  8. Questions from Tableau Training: Adding Conditional Formatting
  9. Questions from Tableau Training: Setting Weekday Start
  10. Questions from Tableau Training: How Do ZIP Codes Work in Tableau?
  11. Questions from Tableau Training: The Small Grey Bar Within a Quick Filter
  12. Questions from Tableau Training: Matching Mark Color
  13. Questions from Tableau Training: Showing the Null Indicator
  14. Questions from Tableau Training: Can I Manually Set the Colors of a Stepped Gradient?
  15. Questions from Tableau Training: How Can I Get Box Plot Data into a Crosstab?
  16. Questions from Tableau Training: How Do I Clear a Worksheet? Make a Copy?
  17. Questions from Tableau Training: Opening URL Actions Inside of a Dashboard
  18. Questions from Tableau Training: Can I Move Mark Labels?
  19. Questions from Tableau Training: How Can I Use My Current Report to Create a Viz?
  20. Questions from Tableau Training: Can I Create Text Hyperlinks on a Dashboard?
  21. Questions from Tableau Training: How Can I Transform My Crosstab into a Flat List?
  22. Questions from Tableau Training: Labeling the Top N
  23. Questions from Tableau Training: How Can I Customize Charts with Parameters?
  24. Questions from Tableau Training: Combining Measures into a Single Line
  25. Questions from Tableau Training: How Can I Create Custom Color Palettes?
  26. Questions from Tableau Training: Can a Top N Parameter be Nested Within Other Fields?
  27. Questions from Tableau Training: Conditional Scope on Tableau Calculations
  28. Questions from Tableau Training: Top Ten Plus N
  29. Questions from Tableau Training: Dynamic Label Positioning
  30. Questions from Tableau Training: Using Cross Joins to Solve Active Tickets
  31. Questions from Tableau Training: Top N Highlight Table
  32. Questions from Tableau Training: How to Use Specific Dimensions in Table Calculations
  33. Questions from Tableau Training: Moving Reference Line Labels
  34. Questions from Training: Comparing Metrics for Same Weekday in Previous Year
  35. Questions from Tableau Training: Colouring Specific Columns and Rows in a Crosstab
  36. Questions from Tableau Training: Creating a Custom Legend as a Sheet
  37. Questions from Tableau Training: How Can I Draw a 45-Degree Angle?
  38. Questions from Tableau Training: Down the Aggregation Rabbit Hole
  39. Questions from Tableau Training: Percent Change from Previous Period on a Map
  40. Questions from Tableau Training: Union File Names as Years
  41. Questions from Tableau Training: Conditional Coloring on Sparklines
  42. Questions from Tableau Training: Moving Column Headers to the Top of the View
  43. Questions from Tableau Training: Isolating Rank with Parameters and Calculations

More About the Author

Jon Bajon

Analytics Consultant
Tableau Viz: How Much Heat Can You Handle? It might sound controversial, but a common practice in my family (and many families throughout Louisiana) was something called ...
Questions from Tableau Training: Can a Top N Parameter be Nested Within Other Fields? The latest question from Tableau Training comes from Ryan, who was in a DII: Intermediate course in New York City. “I know I can ...

See more from this author →

InterWorks uses cookies to allow us to better understand how the site is used. By continuing to use this site, you consent to this policy. Review Policy OK

×

Interworks GmbH
Ratinger Straße 9
40213 Düsseldorf
Germany
Geschäftsführer: Mel Stephenson

Kontaktaufnahme: markus@interworks.eu
Telefon: +49 (0)211 5408 5301

Amtsgericht Düsseldorf HRB 79752
UstldNr: DE 313 353 072

×

Love our blog? You should see our emails. Sign up for our newsletter!