
Our Certified Tableau Trainers are asked a myriad of questions each day. In this series, they share some answers.
Here’s a question I’ve heard often during training sessions:
“How can I customize my charts with parameters?”
If you’ve spent some time in Tableau you’ve most likely encountered parameters. Parameters can be an excellent addition to any workbook because they allow viewers to interact and make selections on your worksheets and dashboards. Using parameters to make selections is a fairly common use case, but did you know parameters can be used to change the level of detail of the view or apply different colors? Let’s take a look at a quick example of each.
Using the Sample – Superstore data set that ships with Tableau, let’s consider a simple view. Dragging Category to columns and Sales to rows gives us the visual shown below:
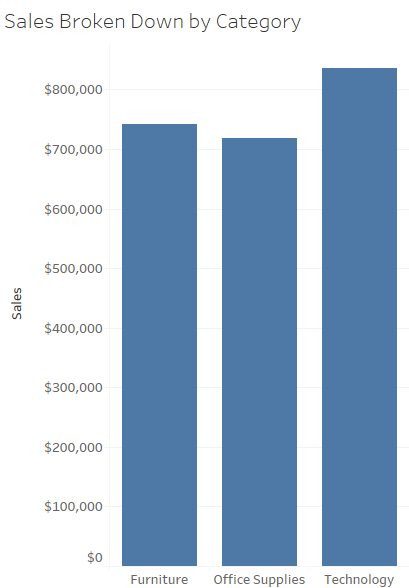
What if we wanted to provide our users with the option to drill down to see the Sales breakdown by each of our Sub-Categories rather than our Categories? We could create a new view entirely, but showing them both on a dashboard will take up valuable space. However, if we were to create a parameter, we could keep one view, but have the ability to toggle between Category or Sub-Category.
Remember there are four steps to using parameters successfully:
- Create the parameter
- Show the parameter control
- Create a calculated field that references the parameter
- Use the calculated field in the view
Creating Parameters
Let’s start with creating the parameter:
This is just one of the many ways to create a parameter.
We want to give the parameter a name that is actionable so our viewers will know to do something when the menu options are revealed. I chose Choose a Breakdown Level as my name for this example. We have a bit of flexibility with which data type to go with. Here, I selected string because it provides a little more flexibility in typing out my values and is normally my go-to. I named the two values Category and Sub-Category to mimic the fields that the parameter will refer to, as we’ll see in the next step.
If concerned about performance, use Boolean (True/False) for a more optimized parameter when there are only two values.
Show the Parameter Control
Now that our parameter is created, let’s show the parameter control. The parameter control provides a show (quick) filter like menu for my users to interact with. You can show the parameter control by right-clicking on your parameter within the data pane and selecting the second option in the list, Show the Parameter Control.
When in doubt just right-click!
Create a Calculated Field
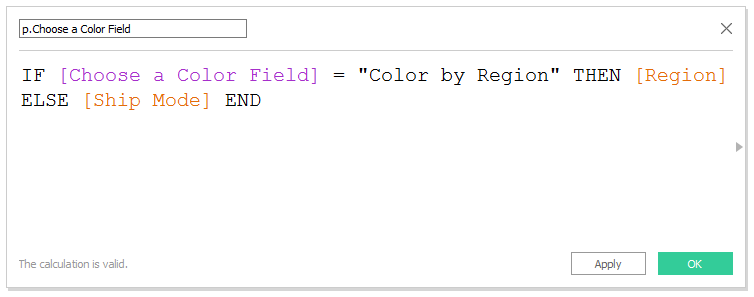
Great! Now it’s time to create the calculated field that communicates with our parameter. It is important to note that there are a few different ways to write this calculation. Whether we use case statements, functions, or if-then logic we will end up with the same result, but I chose if-then logic for this example. The if-then works best here since there are only two possibilities.
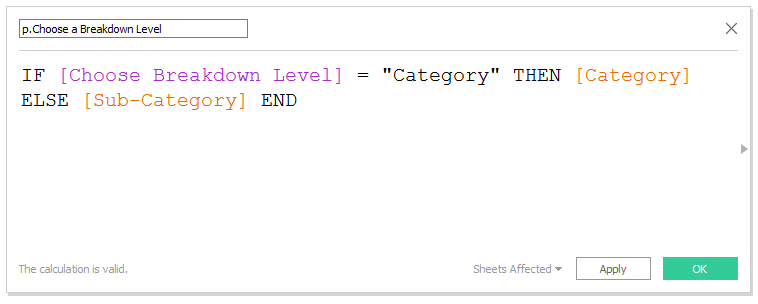
Try starting your parameter names with a “p.” to make them easier to identify in your data pane.
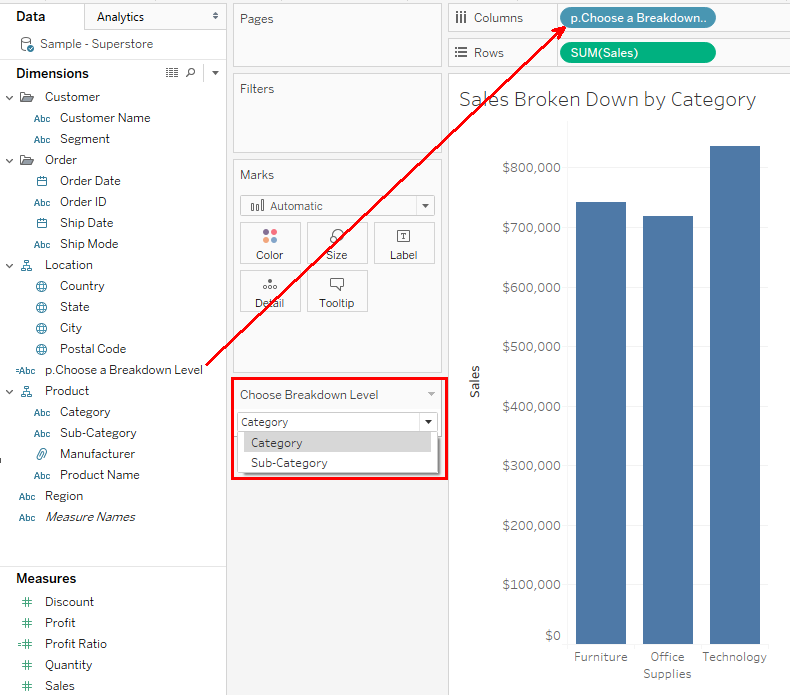
Use the Calculated Field in the View
All that’s left is to use the calculated field in the view. Replace Category on columns with our new calculated field, so that whenever the parameter is changed, it will change the view by assigning a different value to our calculated field on columns. Since the parameter switches between Category and Sub-Category it will change the level of detail by drilling down into the sub-categories or drilling up into category.
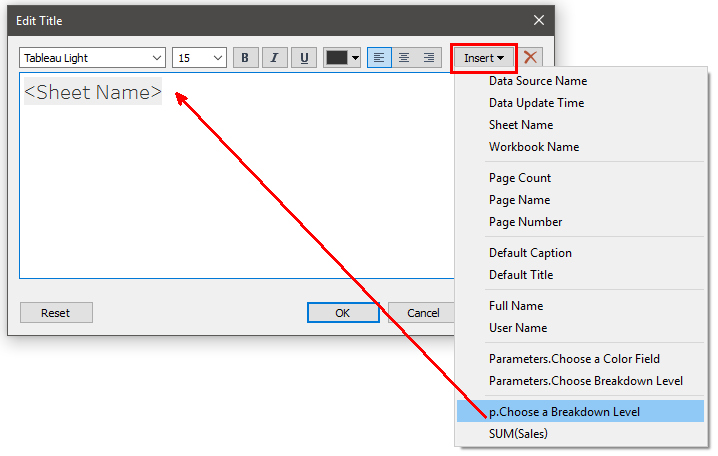
If you are paying close attention, you may have noticed that the title does not change when the parameter switches. It seems a little odd to show the breakdown by Sub-Category, but still have the title display Category. Luckily for us, Tableau makes this very easy by providing the option to insert the parameter directly in the title located within the edit title menu.
Fantastic! Now let’s say you wanted to see the breakdown of your Categories or Sub-Categories by Region and Ship Mode. Rather than creating additional visuals, we can harness the power of parameters to allow our views to choose what is most important to them!
I started by creating another parameter, this time naming my parameter Choose a Color Field. Following the same procedure as above, I choose string as my data type and named the two values Color by Region and Color by Ship Mode to mimic the fields that the parameter will refer to.
If concerned about performance, use Boolean (True/False) for a more optimized parameter when there are only two values.
Next up, I show the parameter control and create the calculated field to tell the control what to do.
Try starting your parameter names with a “p.” to make them easier to identify in your data pane.
Finally, I want to use my new calculation, Choose a Color Field on the Color shelf and test to see if my parameter works as I designed.
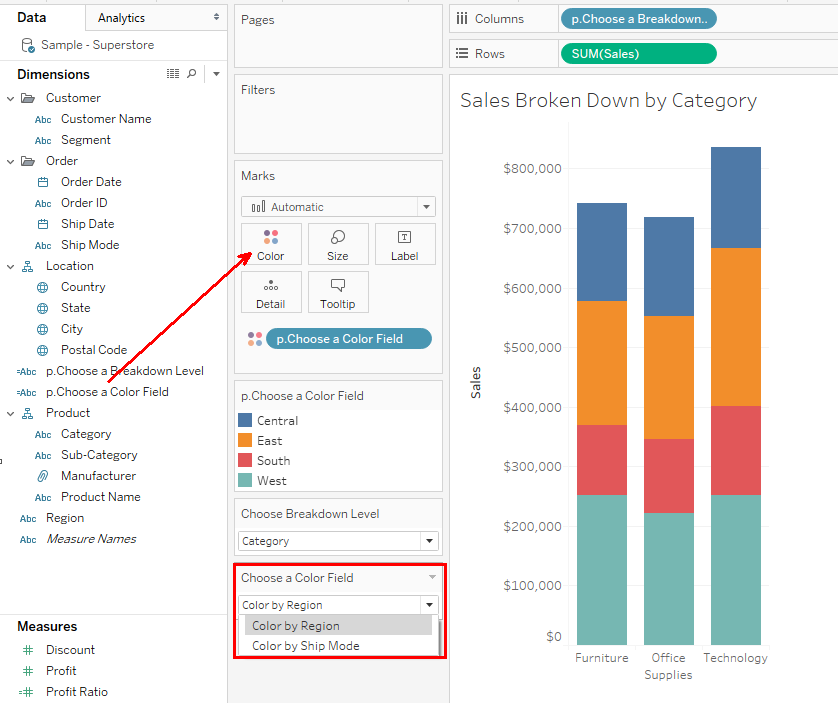
I’ve create a single view that now can be drilled up and down to different hierarchy levels as well as an ability to analyze my Sales by Region or Ship Mode using color to create stacked bars. Now our users have the control to choose any option from our parameter, and they will a change in the level of detail, color, and title.
Behold the power of parameters! Pretty awesome!
If you find yourself craving more knowledge about parameters, take a look a my colleague Robert Curtis’ Deep Dive into parameters found here for the full ins and outs.