Our Certified Tableau Trainers are asked a myriad of questions each day. In this series, they share some answers.
A common question that comes up in trainings is:
“I accidentally removed the null indicator, how do I get it back (without using undo)?”
Ignoring the null indicator on visualizations can often cause discomfort among end users as they may believe that something is wrong. In certain charts, a null indicator does not mean that the data is bad or something is wrong. Instead, it shows that there is no value for particular calculation.
Let’s look at a sample report that shows the year-over-year growth for profit:
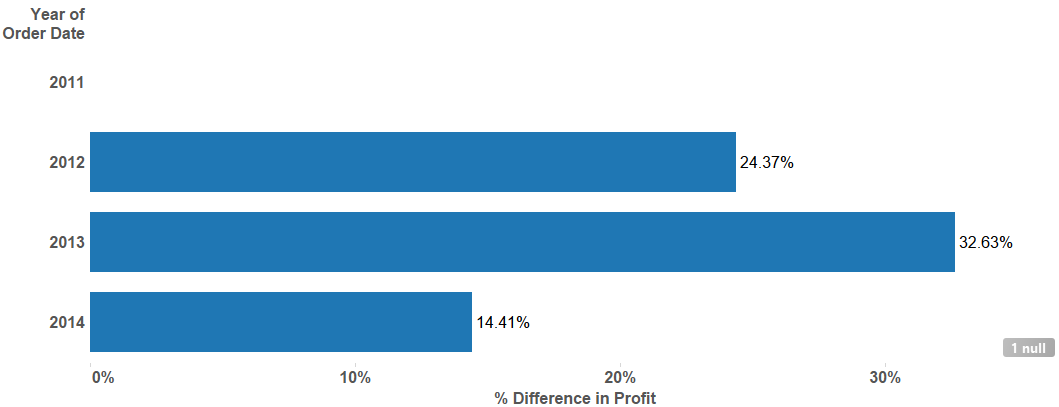
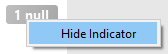
In this example above, the year-over-year growth is calculated from the previous year. There was a 14.41% increase from 2013, 32.63% from 2012 and 24.37% from 2011, but there is no value listed under 2011. This is because there are no 2010 records in the data set. With no 2010 records, no growth can be calculated. This causes the 1 Null indicator to be displayed. There is nothing wrong with the chart, but we may want to hide the null indicator to avoid confusion with our end users. Right-clicking the null indicator will give you this option:
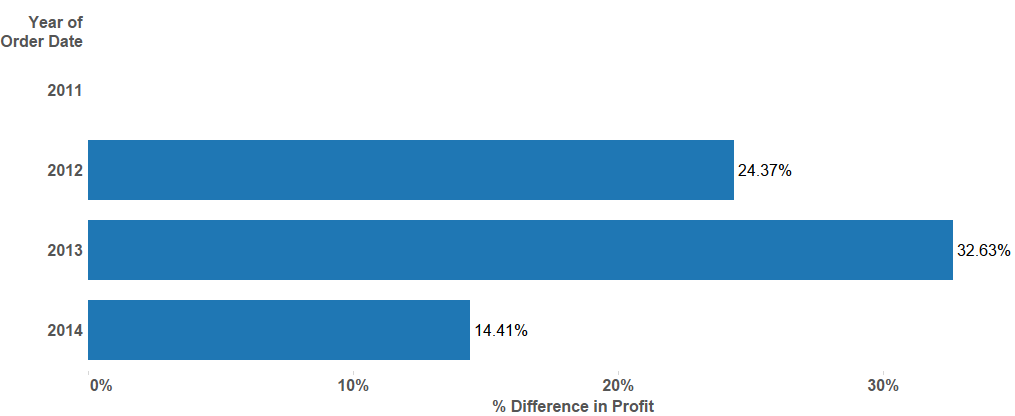
Now that it’s gone, how do I get it back in case I want to select some of the additional options? The secret lies within the Analysis menu, under the guise of Special Values. Make sure to select Show to bring the null indicator back on the view:
Want More Questions from Tableau Training
- Questions from Tableau Training: Quick Filter Interaction
- Questions from Tableau Training: Labeling with Table Calculations
- Questions from Tableau Training: Speeding Up Presentation Views when Using Tableau
- Questions from Tableau Training: Dashboard Actions
- Questions from Tableau Training: Business Day Calculations
- Questions from Tableau Training: Adding Gaps Between Bars
- Questions from Tableau Training: When to Pivot Data in Tableau
- Questions from Tableau Training: Adding Conditional Formatting
- Questions from Tableau Training: Setting Weekday Start
- Questions from Tableau Training: How Do ZIP Codes Work in Tableau?
- Questions from Tableau Training: The Small Grey Bar Within a Quick Filter
- Questions from Tableau Training: Matching Mark Color
- Questions from Tableau Training: Showing the Null Indicator
- Questions from Tableau Training: Can I Manually Set the Colors of a Stepped Gradient?
- Questions from Tableau Training: How Can I Get Box Plot Data into a Crosstab?
- Questions from Tableau Training: How Do I Clear a Worksheet? Make a Copy?
- Questions from Tableau Training: Opening URL Actions Inside of a Dashboard
- Questions from Tableau Training: Can I Move Mark Labels?
- Questions from Tableau Training: How Can I Use My Current Report to Create a Viz?
- Questions from Tableau Training: Can I Create Text Hyperlinks on a Dashboard?
- Questions from Tableau Training: How Can I Transform My Crosstab into a Flat List?
- Questions from Tableau Training: Labeling the Top N
- Questions from Tableau Training: How Can I Customize Charts with Parameters?
- Questions from Tableau Training: Combining Measures into a Single Line
- Questions from Tableau Training: How Can I Create Custom Color Palettes?
- Questions from Tableau Training: Can a Top N Parameter be Nested Within Other Fields?
- Questions from Tableau Training: Conditional Scope on Tableau Calculations
- Questions from Tableau Training: Top Ten Plus N
- Questions from Tableau Training: Dynamic Label Positioning
- Questions from Tableau Training: Using Cross Joins to Solve Active Tickets
- Questions from Tableau Training: Top N Highlight Table
- Questions from Tableau Training: How to Use Specific Dimensions in Table Calculations
- Questions from Tableau Training: Moving Reference Line Labels
- Questions from Training: Comparing Metrics for Same Weekday in Previous Year
- Questions from Tableau Training: Colouring Specific Columns and Rows in a Crosstab
- Questions from Tableau Training: Creating a Custom Legend as a Sheet
- Questions from Tableau Training: How Can I Draw a 45-Degree Angle?
- Questions from Tableau Training: Down the Aggregation Rabbit Hole
- Questions from Tableau Training: Percent Change from Previous Period on a Map
- Questions from Tableau Training: Union File Names as Years
- Questions from Tableau Training: Conditional Coloring on Sparklines
- Questions from Tableau Training: Moving Column Headers to the Top of the View
- Questions from Tableau Training: Isolating Rank with Parameters and Calculations