Our Certified Tableau Trainers are asked a myriad of questions each day. In this series, they share some answers.
A common question that comes up in trainings is:
“How do ZIP codes work in Tableau? Do I need to add in leading zeros, or can I leave them out?”
As geographic fields become increasingly available in the field of analytics, aggregating customer information to ZIP code level becomes greatly desired. Tableau offers a great way to visualize ZIP code level information, but understanding how it works can be a little confusing.
Let’s look at a sample data set that shows examples of ZIP code for a few different states:
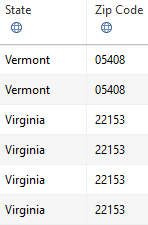
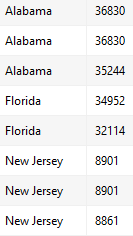
We can see that for Alabama, Florida and Virginia ZIP codes are five digits. But for Vermont and New Jersey, where ZIP codes start with a 0, we see two different data entry styles. So, which one is correct?
Looking closely, we see the globe symbol underneath the Zip Code column. This indicates that Tableau is able to recognize the raw data numbers as geographic ZIP code field. If you do not see this symbol in your own data, click on the symbol (possibly a # or Abc icon instead) and change the geographic role to ZIP Code / Postcode:
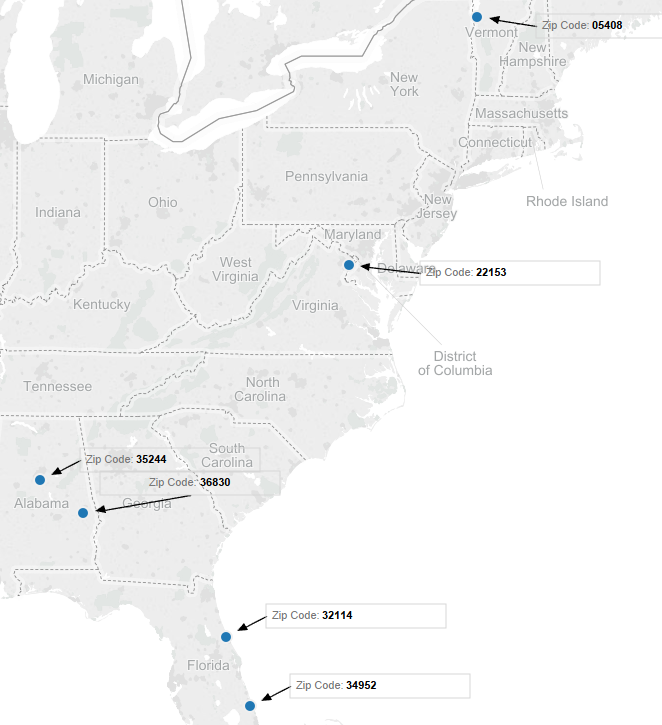
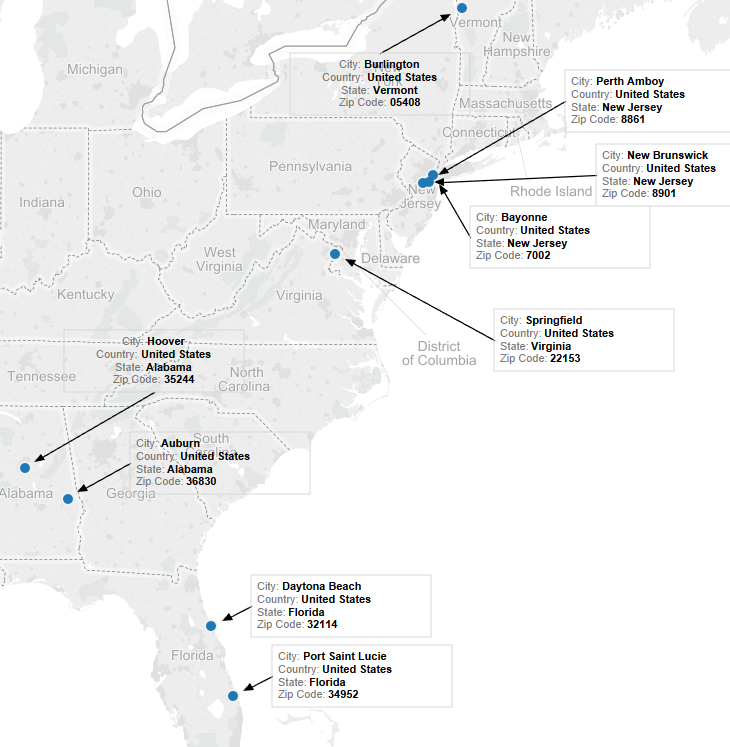
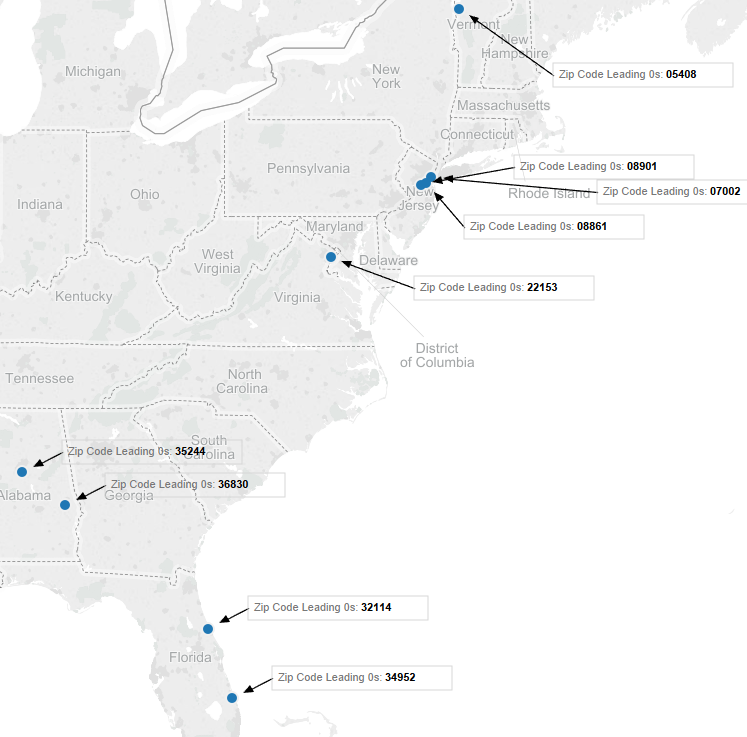
We can see that Vermont ZIP codes (ones with the leading 0) were plotted, but New Jersey ZIP codes were not. A quick way to get around this issue is to add more detail to our map. Adding additional geographic fields to detail on the marks card will fix the problem of the unknown ZIP codes (tooltip annotations shown):
Don’t have additional geographic fields in your data set? No problem! Right-click on Zip Code in the data pane and create a calculated field. In the calculated field, type the formula below:

Right-click on the symbol Abc for your new ZIP code field and change the geographic role to ZIP Code / Postcode. Drag this new field to details on the marks card to get all ZIP codes plotted below (tooltip annotations shown):
Either method you choose should help you master plotting ZIP codes in Tableau.

