
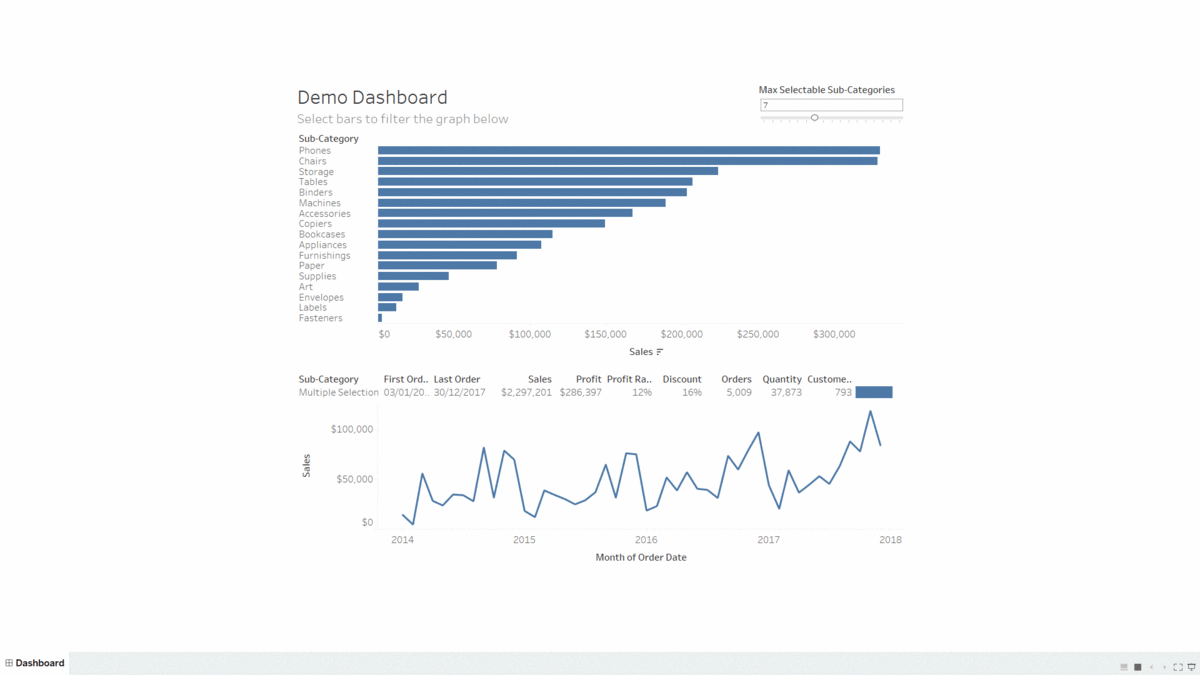
While attending the Tableau Conference in London, we received many interesting questions. I want to share one of them here. We want to see sales performance over time. What if we sometimes want to compare different sub-categories separately and just want to see the development overall (for all sub-categories together)?
Let’s say you have a bar chart that shows sales performance per sub-category and you have a timeline that shows sales development over time. Looking at all sub-categories (we have 17 in Global Superstore) won’t be easy. Tableau by default shows all sub-categories. The view will be cluttered.
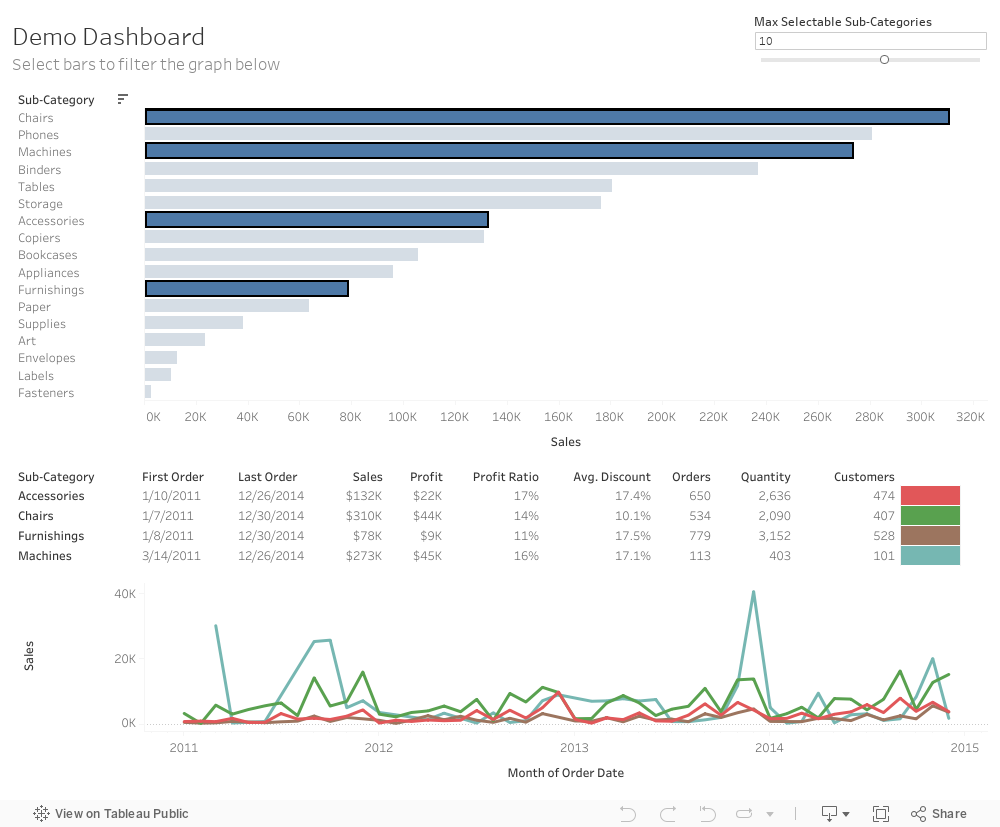
With the following trick, you can dynamically select sub-categories on the bar chart and it will add a colour per sub-category on the timeline. With a slider, you can control a parameter specifying how many sub-categories (colours) you want to see. When the maximum number of colours is reached, or all bars are deselected, the timeline shows the sum of sales for all sub-categories as one line.
How to Build It in Tableau
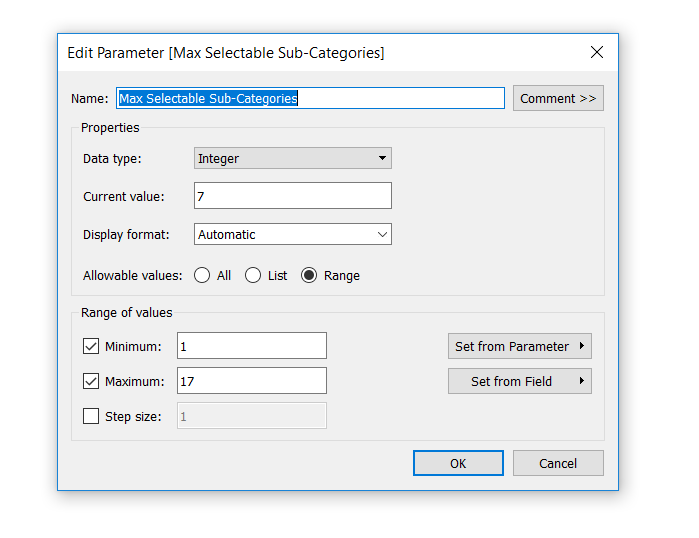
First, we will create a parameter that will define the maximum number of sub-categories we want to see on colour and on the timeline. If you aren’t familiar with parameters yet, Robert Curtis wrote a great Tableau Deep Dive series about parameters.
Secondly, we will use this parameter in calculations that will be swapping the sheets. One sheet will be showing a separate coloured line per each selected sub-category, and the other will be showing development for all sub-categories in total. Here you can find more details about sheet swapping on dashboards.
We will also use fixed level of detail calculations (LOD) in curly brackets to fix the number of sub-categories. Otherwise, the number of sub-categories will be changing when we start using filters. To learn more about LODs, I definitely recommend reading the 15 LODs blog post by Bethany Lyons and the LOD Deep Dive series by Robert Curtis.
Here are the calculations:
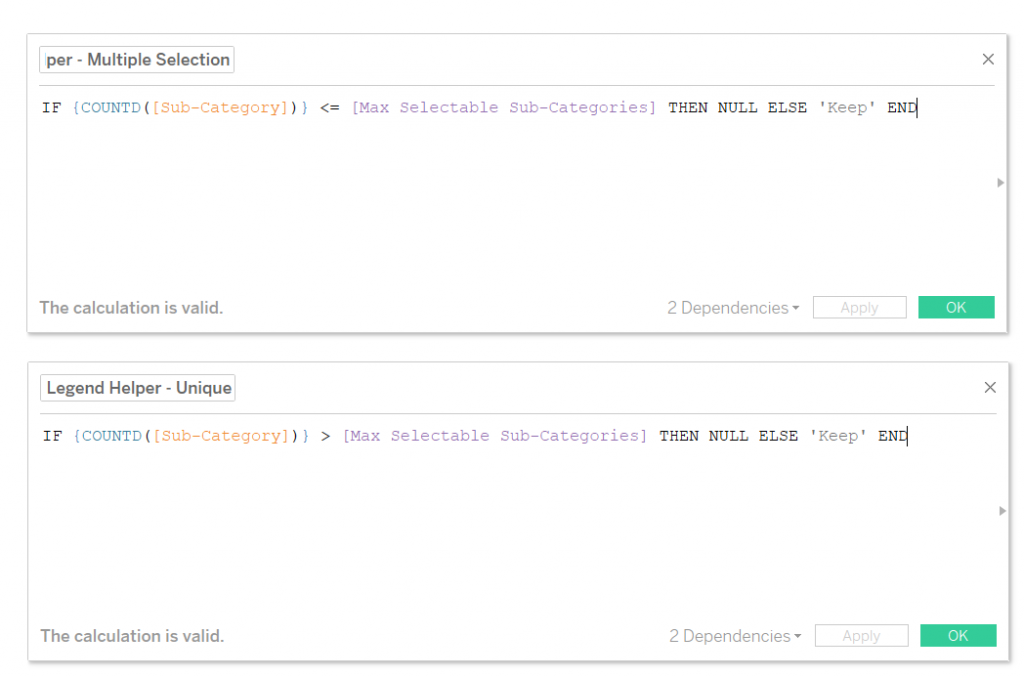
Next, let’s create the view with information we want to show. Add KPIs you are interested in. We will create two identical sheets. We will put our Unique helper calculation on Filter in the first sheet where we will display selected sub-categories. We will use Multiple helper calculation in another sheet that will show total sales and other KPIs over time.
We will use a bar chart to create a colour legend and we will use another calculation, Sub Category Colour, to colour the legend dynamically. You will receive the view below:
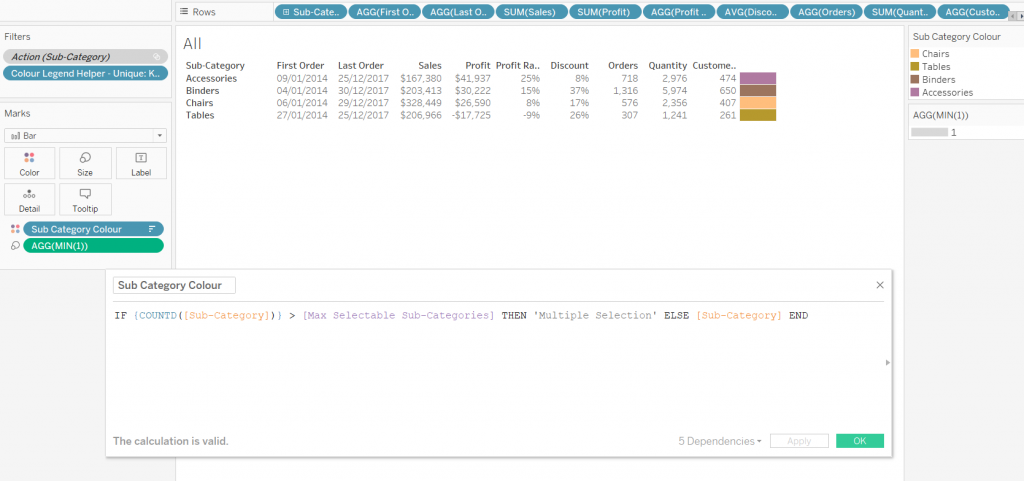
Now, we need to create two more views: a line chart, where we will use the Sub Category Colour calculation on colour (as well as in previous two sheets), and a sorted bar chart per sub-category.
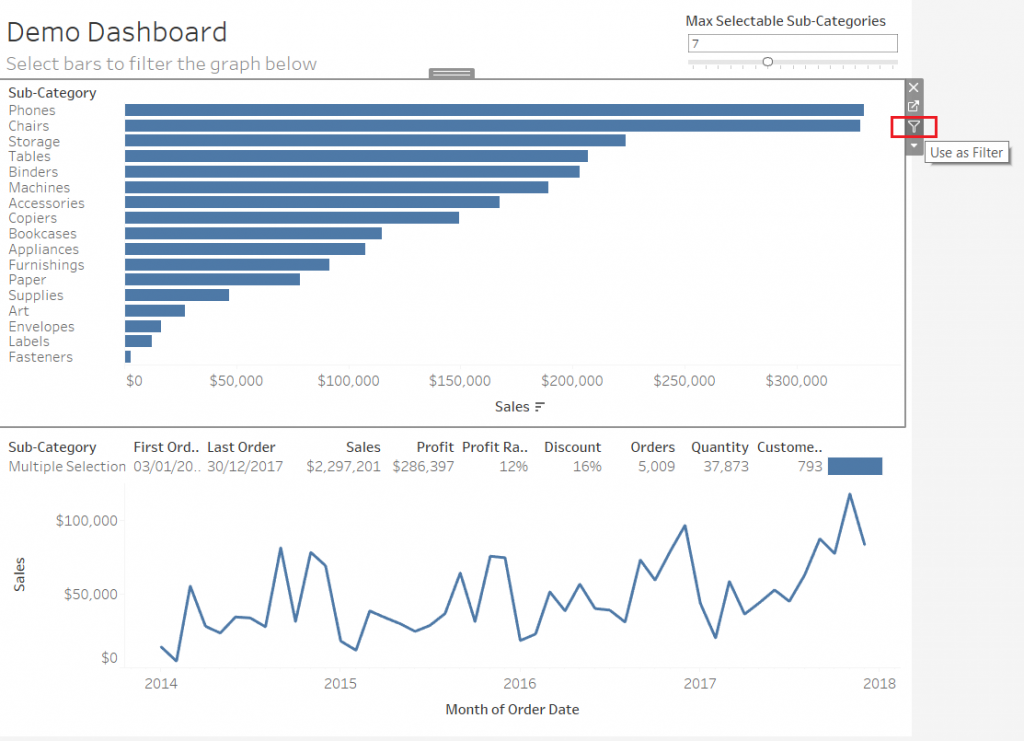
Let’s build a dashboard and bring it all together. We will use the sub-category by sales chart as a filter:
Now, the last and the most important part: We will go to every sheet and switch the action filter to context. Below is the workbook if you want to try it yourself. Happy Tableauing!
Special thanks to Carl Slifer for his contribution to this article.
Related
