
The new Tableau release 2020.2 is around the corner, and we are all excited about the new features it’s bringing. In this blog, we will be talking about the New Data Model. This feature can give you much more flexibility and change the way you are working with the data sources. With the New Data Model, Tableau introduces relationships, which is a more flexible alternative to the existing joins. Tableau defines them this way:
Relationships are a new way to combine data that is easy, fast and more flexible than using joins. A relationship describes how two tables relate to each other, based on common fields, but does not merge the tables together.
Testing out the New Data Model
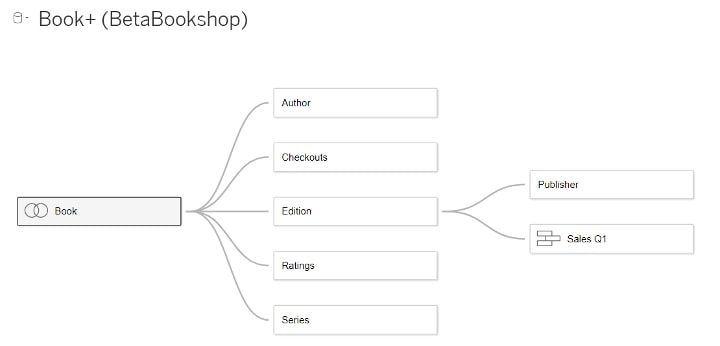
Let’s see how it looks in practice. We will be using a Bookshop example, an Excel file available in Tableau Beta. In the data source window, we bring first table (Book) to the canvas and then drag another table (Author). Previously, Tableau would try to create a join. Now, however, it will create a line or a curve, called a noodle, which represents that tables are related. In the relationships dialog window, you can specify the fields that are related. In our case, we will tell Tableau to use Author ID to create connection.
You can also specify cardinality of relationship: many to many, one to one or one to many, as well as referential integrity meaning that some records match, or all records match. You can read more about it in the Tableau article. By default, Tableau uses many to many, some records match. Tables will remain unmerged and you can specify the behaviour (left, right, inner or outer join) per view. Joins and unions remain available. You need to double click on the table you want to create join or union on.
In canvas, you will now see the logical layer first and by clicking on the tables with join or union diagram, you can see a familiar physical layer:
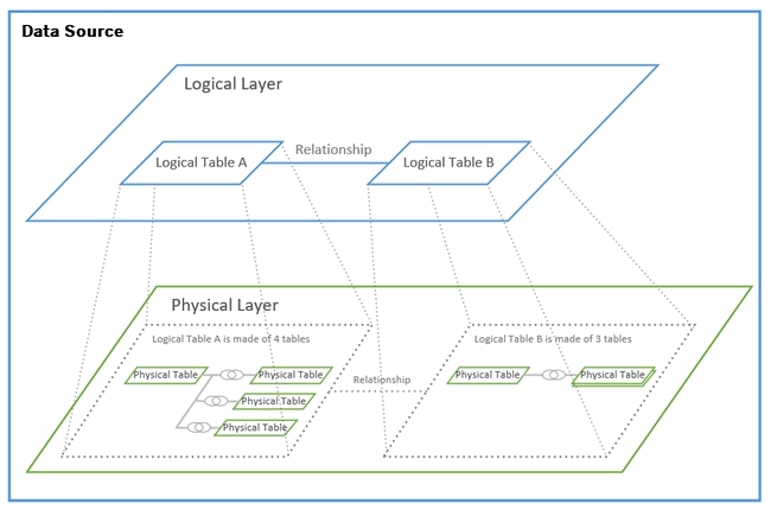
This is how it looks in practice:
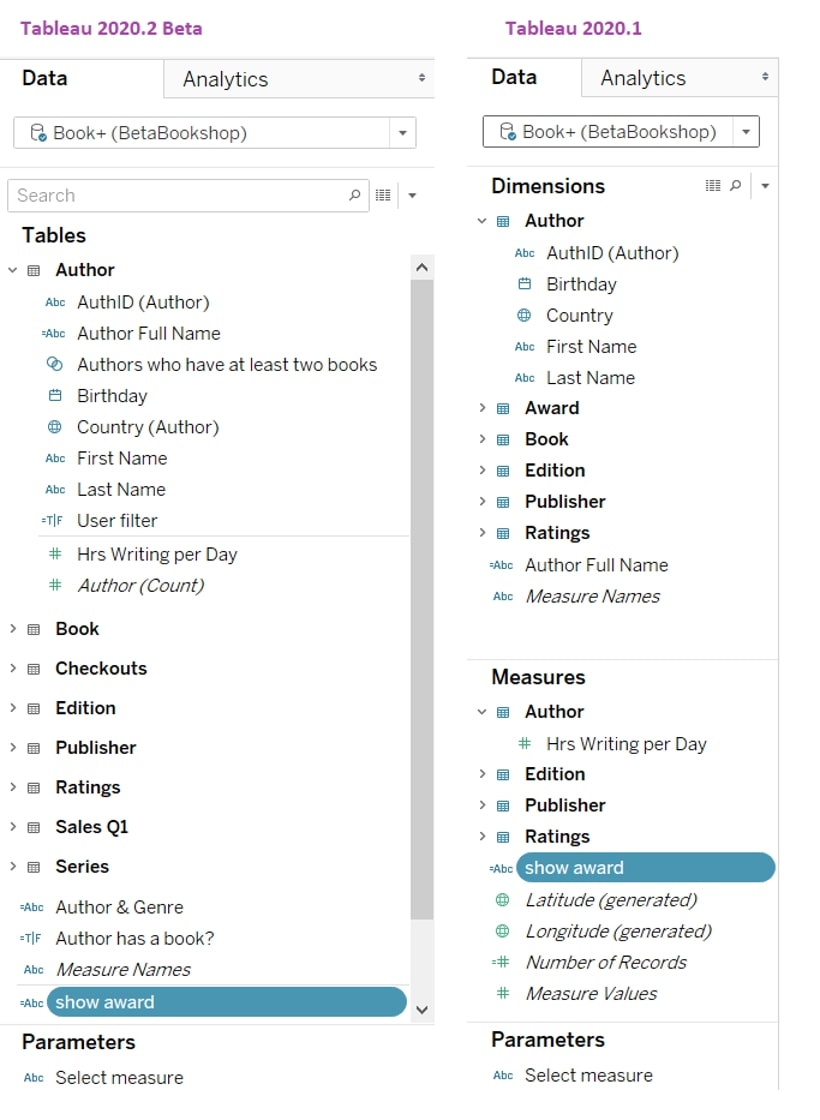
The data grid is now showing data per table (because tables aren’t merged yet); therefore, you need to select the table to see the data. Notice some changes in the Data pane window in the worksheet:
- Tables are stacked on top of each other, and each table contains its dimensions and measures. Number of Records has changed to local Count per table.
- Latitude, longitude, measure names and measure values appear at the bottom under the last table.
- Sets and row level calculations will appear in the table they belong to, whereas aggregated calculations and calculations from different tables will appear at the bottom after the last table because they have an undefined level of detail. Aggregations have level of detail in the viz.
Comparing Views in 2020.1 and 2020.2 Beta
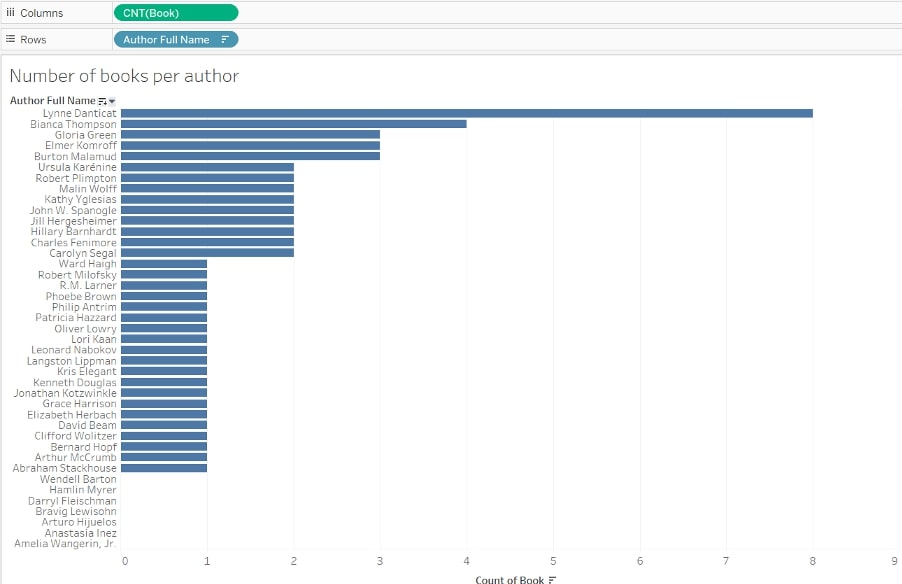
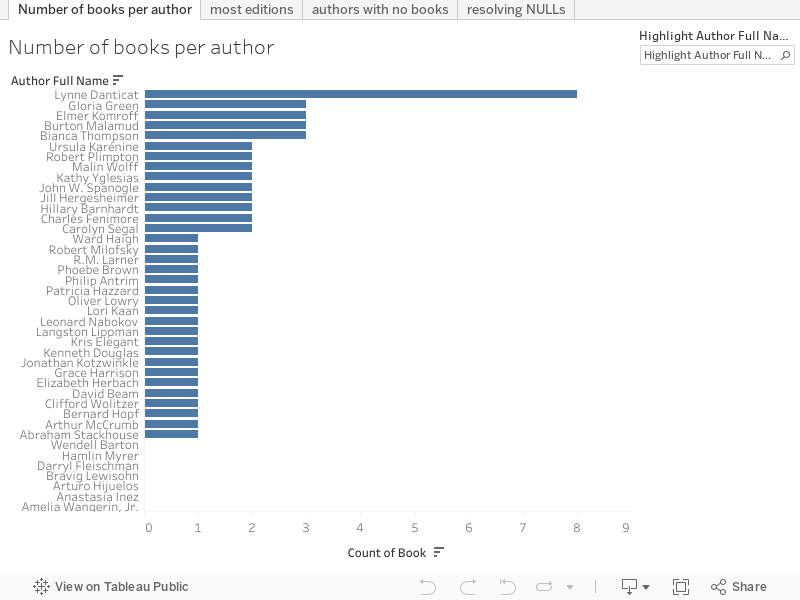
To explore the behaviour, I’ve created a chart that shows the number of books per author in 2020.2 Beta and 2020.1 versions. In Beta version using the new Data Model, there are 34 authors that have at least one book, and seven authors that don’t have any books. However, I only see 34 authors in the older version 2020.1. This is because in the older version (2020.1), I needed to define the join in the data source window, and I originally created left join on book ID. As a result, authors that don’t have any books were excluded from the resulting table. When changing connection to outer joins, both charts looks the same:
In the New Data Model, Tableau won’t show you NULLs by default. Only when you bring measures to the view can you see if there are mismatches in data. For example, if you bring Auth ID in Book table and AuthID from Author table to the view, Tableau will show you matched IDs. In our case, there are 34 authors. However, when we bring a measure from the Author table to the view—for example, Count(Author)—then we will see that we have some authors without books.
Feel free to download the workbook below, and try this out for yourself:
Improved Flexibility and Easier Upkeep
To summarize, the New Data Model brings you more flexibility. You can keep full domain when exploring your data with dynamic joins. The join is created on the fly defined by the context of dimensions and measures in the view. Tableau will query only tables that are used in the view. This should have significant performance improvements on live connections when you have several joins in your data source. Plus, you create and maintain fewer data sources because you don’t have to create specific data sources to be used in only one or two views.
A Close Look at Relationships
In her blog, Stefanie Niemzok builds on this post and compares relationships, joins and blends. Furthermore, I really recommend watching this video of Bethany Lyons during Tableau Conference where she shows several helpful examples: how to define joins per view, why you need fewer calculations to “correct” duplicates, LODs and a look at self-relationships vs. self-joins.
Enjoy!