
Whether you are new to Tableau or have been using the tool for quite some time, Tableau provides a wide variety of options to improve your skills, get in touch with other community members, contribute to the data community and get inspired. In this blog post, I want to give an overview of different initiatives and how you can get involved.
First things first: visit the Tableau Community page where you can find many resources. If you are just getting started, watch the intro video.
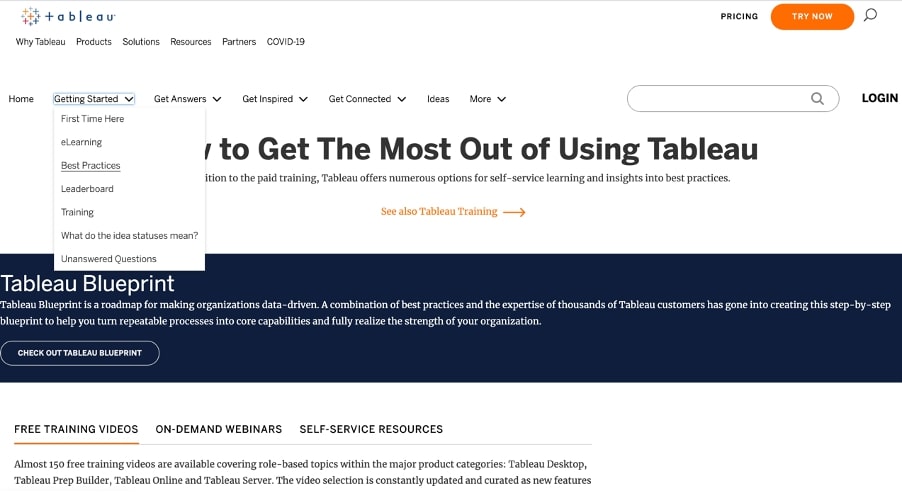
Tableau Support Tailored to Your Goals
The next step depends on what you are looking for. For example, if you are looking for how to solve something using Tableau, you can either watch how-to videos or search for the answers on the Community forums. You can choose from free videos, which can help you get started with the platform, eLearning paths or instructor-led trainings. You can also explore information about different learning opportunities and certifications provided by Tableau. There are plenty of options to choose from, so you can be sure to select the one that will suit you best.
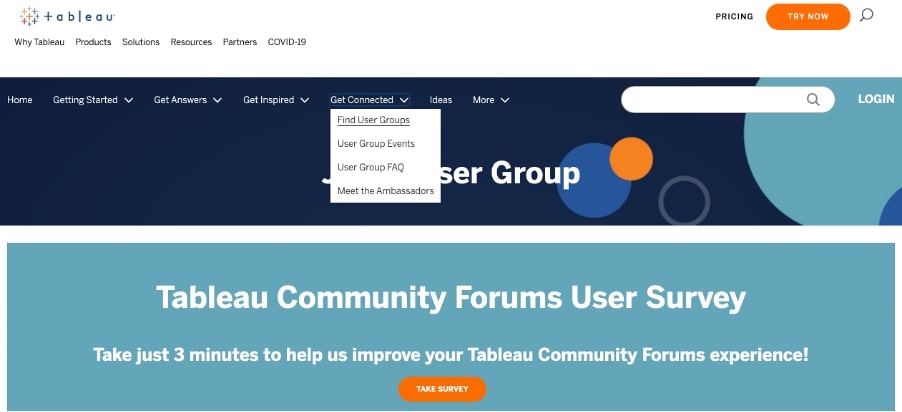
Use the Get Inspired and Get Connected tabs to see what other users create with Tableau and connect with like-minded individuals. In these areas, you can join your local user group or learn how to start a new one. You can read more about Tableau User Groups in this blog post, or discover how to start your own user group in this podcast episode. If you’re in search of dashboard inspiration, definitely check out the Tableau Public Viz Gallery. Here, you can browse data visualizations created by other community members around the world. Plus, you can find great resources on data visualization best practices.
In the Ideas section of the website, you can vote for the new features you’d like to see come to Tableau, as well as propose your own. Some other initiatives curated by Tableau include:
- In mid-October 2020, Tableau launched the Data Literacy free training program with the aim to help many organizations and individuals increase their data-literacy levels. This program lays a great foundation for basic topics including understanding data types, basic statistics concepts and interpreting visualizations. It’s also a great additional resource to the Tableau Blueprint, which provides guidelines on how to build successful data-driven organizations.
- Earlier this year, Tableau launched the Data for Kids initiative, which has some creative ideas on how to introduce your children (5-13 years old) to basic data concepts in an interactive and engaging way. You can learn more about it in this blog post.
- If you want to find a mentor or support others on their data journey, the Tableau Ambassador or Zen Master programs are what you are looking for. Every year, the Tableau Community nominates individuals who share their knowledge, support others and contribute to product development.
- The Tableau Foundation drives several projects with a focus on climate actions, poverty, equity and global health.
Resources from the Broader Data Fam
Of course, there are loads of initiatives out there that have been created by the larger data visualization community. Below are just a few examples:
- Viz for Social Good is a project that pairs nonprofit organizations with volunteer analysts. Nonprofits provide details (datasets, needs and goals), and volunteers help build powerful visualizations that can make a real impact.
- To improve your data visualization skills, you can participate in projects like Makeover Monday, curated by Eva Murray and Andy Kriebel, IronQuest—a program curated by Sarah Bartlett—or the Storytelling with Data monthly challenges led by Cole Nussbaumer Knaflic and her team.
- Tiny Viz Talks provide a platform where people can safely practice their presentation skills when delivering data visualization talks.
I would also recommend finding mentors or people who inspire you and following them on Twitter, LinkedIn, YouTube or their personal blogs. Another great inspiration and way to stay current is to listen to podcasts. Check out episodes from Storytelling with Data, The Tableau Wannabe or InterWorks’ Podcast your Data.
Get Started!
I hope this blog has helped point you in the right direction to plug into the data community. Feel free to reach out to us if there’s anything we can do to support you along the way. Have fun!