Questions from Tableau Training: Moving Column Headers to the Top of the View

Data

Questions from Tableau Training: Moving Column Headers to the Top of the View

Our Certified Tableau Trainers are asked a myriad of questions each day. In this series, they share some answers.

“Tableau is an Excel complement, not an Excel replacement.”

Whenever I teach a training class, I make this point multiple times throughout the course. Each tool has its own set of specialties and comparative advantages that should govern usage. Or, put more simply, there are situations where Excel is the best tool to solve the problem and situations where Tableau is the better option. In a perfect world, we’d always be able to use the appropriate tool. Unfortunately, while the business intelligence landscape is rapidly changing, evolving and improving, it is still a long way from perfection.

This lack of clearly segmented use cases inevitably leads to frustration when we try to use one tool to do something we already know how to do in another tool. When this happens, we find ourselves asking questions like “This is so easy in Excel; why isn’t it as simple in Tableau?” and “Excel can do this, why can’t Tableau?” These questions, if left unanswered, are a threat to adoption and can derail significant progress in other areas where Tableau is the better option. Luckily, a lot of these frustrations can be solved when a feature exists—it just may not be in the place someone is expecting. One example of this that I run into a lot is about moving column headers around in Tableau.

“How do I move my column headers to the top of the view?”

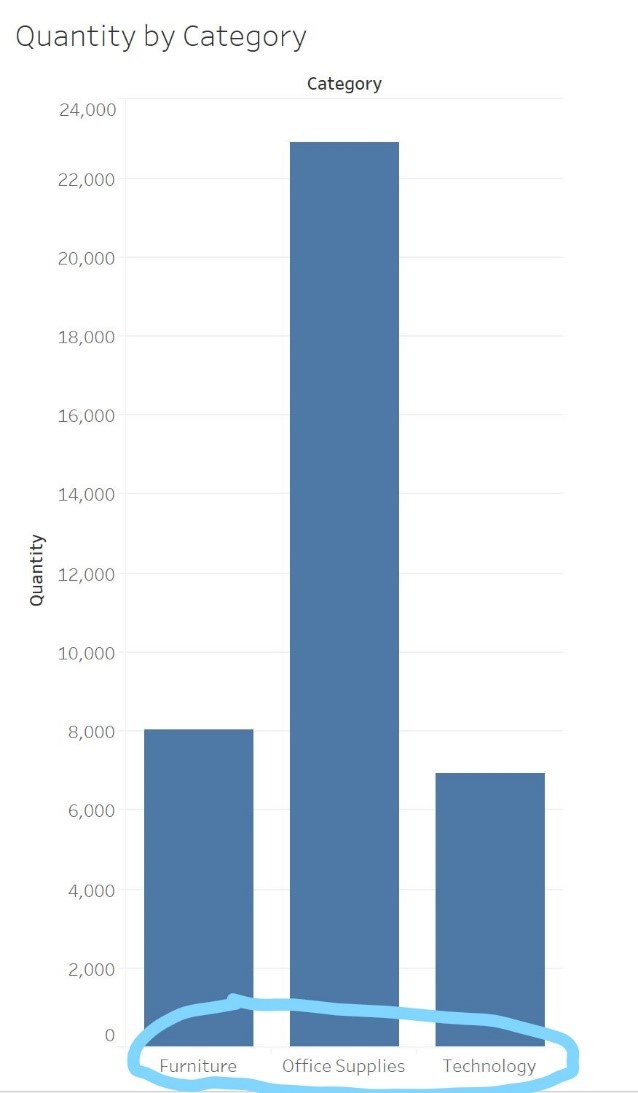
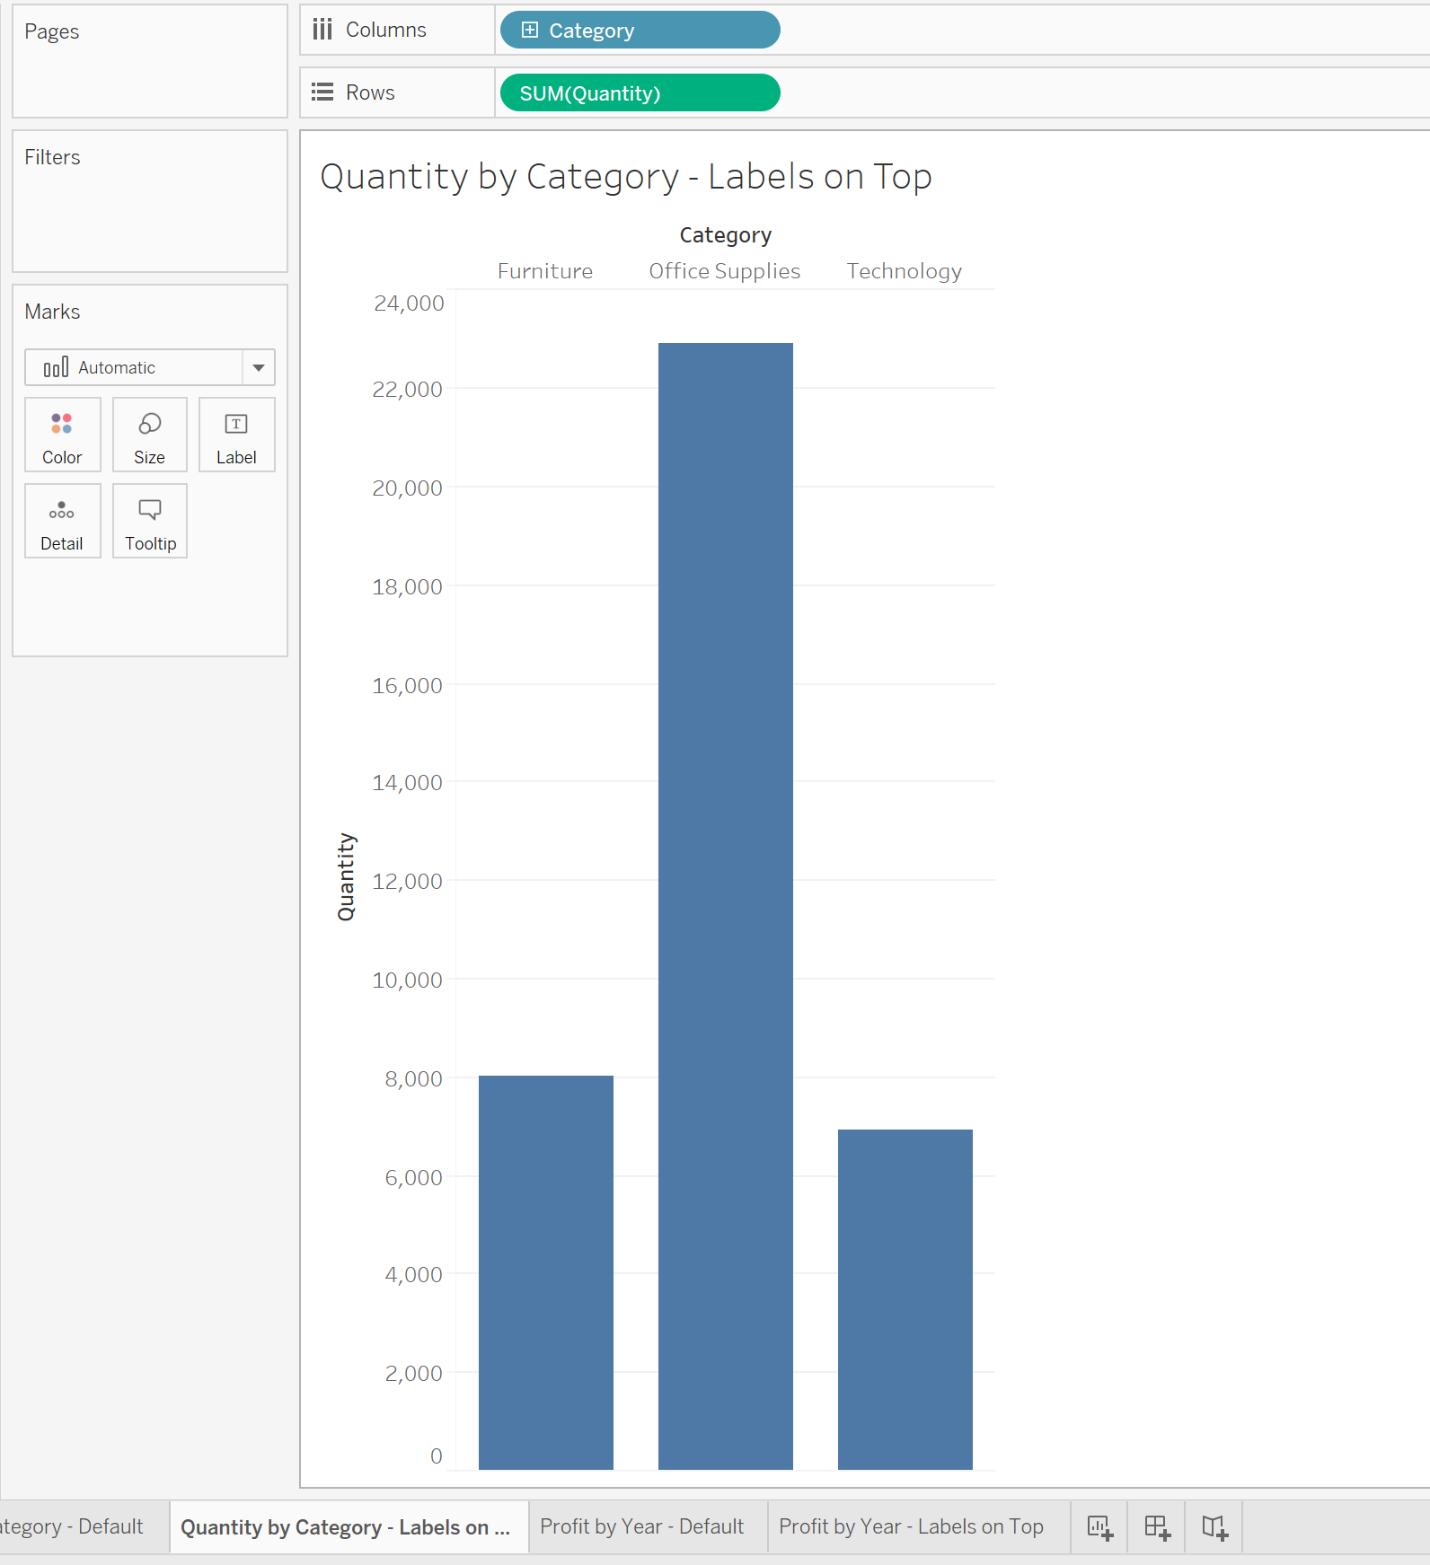
By default, Tableau places column headers at the bottom of the view. For example, when I create a view showing the Sum of Quantity broken out by Category, the label for Category shows up on the bottom of the view.

Note: For reference, I’m using the Sample Superstore dataset included with Tableau.

moving headers to top of view in Tableau

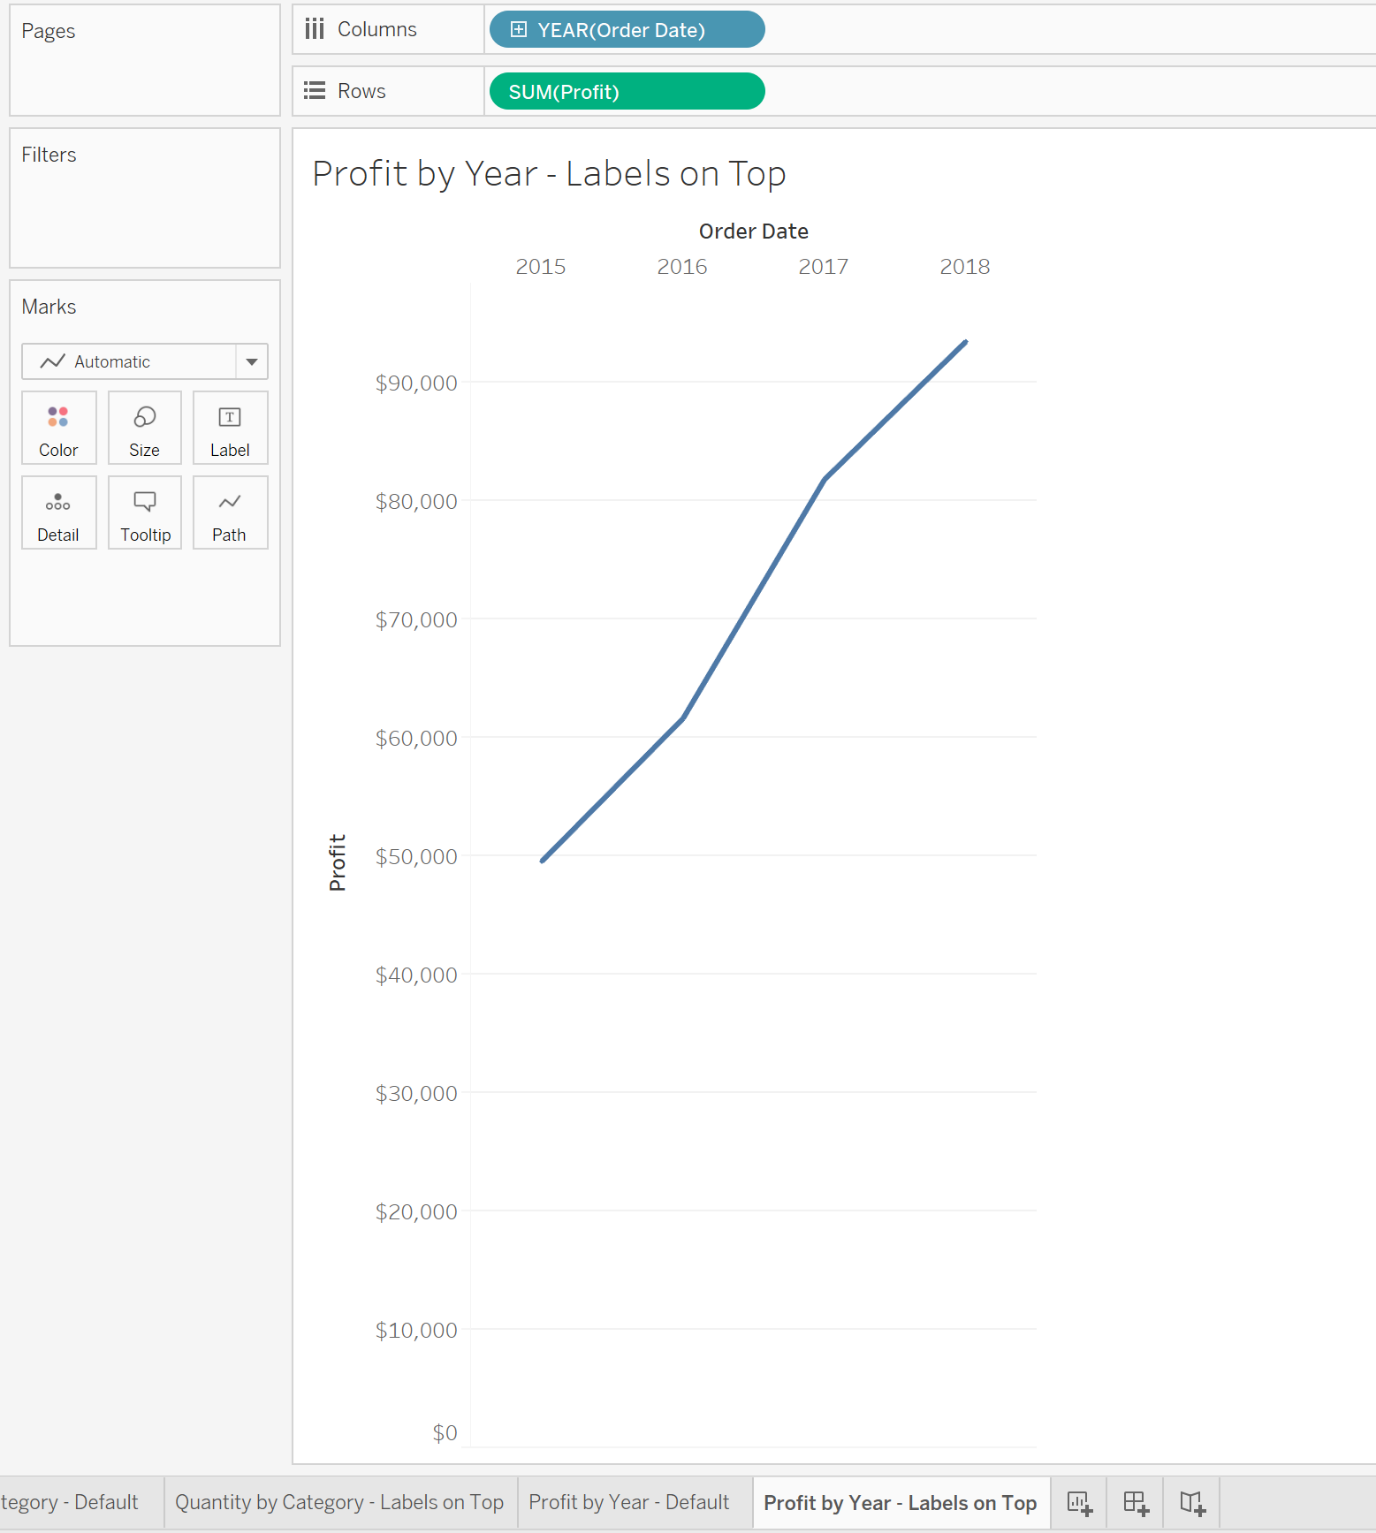
As a long-time Tableau user, this behavior is expected and familiar. For many, though, this is jarring, especially when it comes to looking at year-over-year data. For example, below is a standard line chart Tableau creates by default, visualizing Sum of Profit over four years:

moving headers to top of view in Tableau

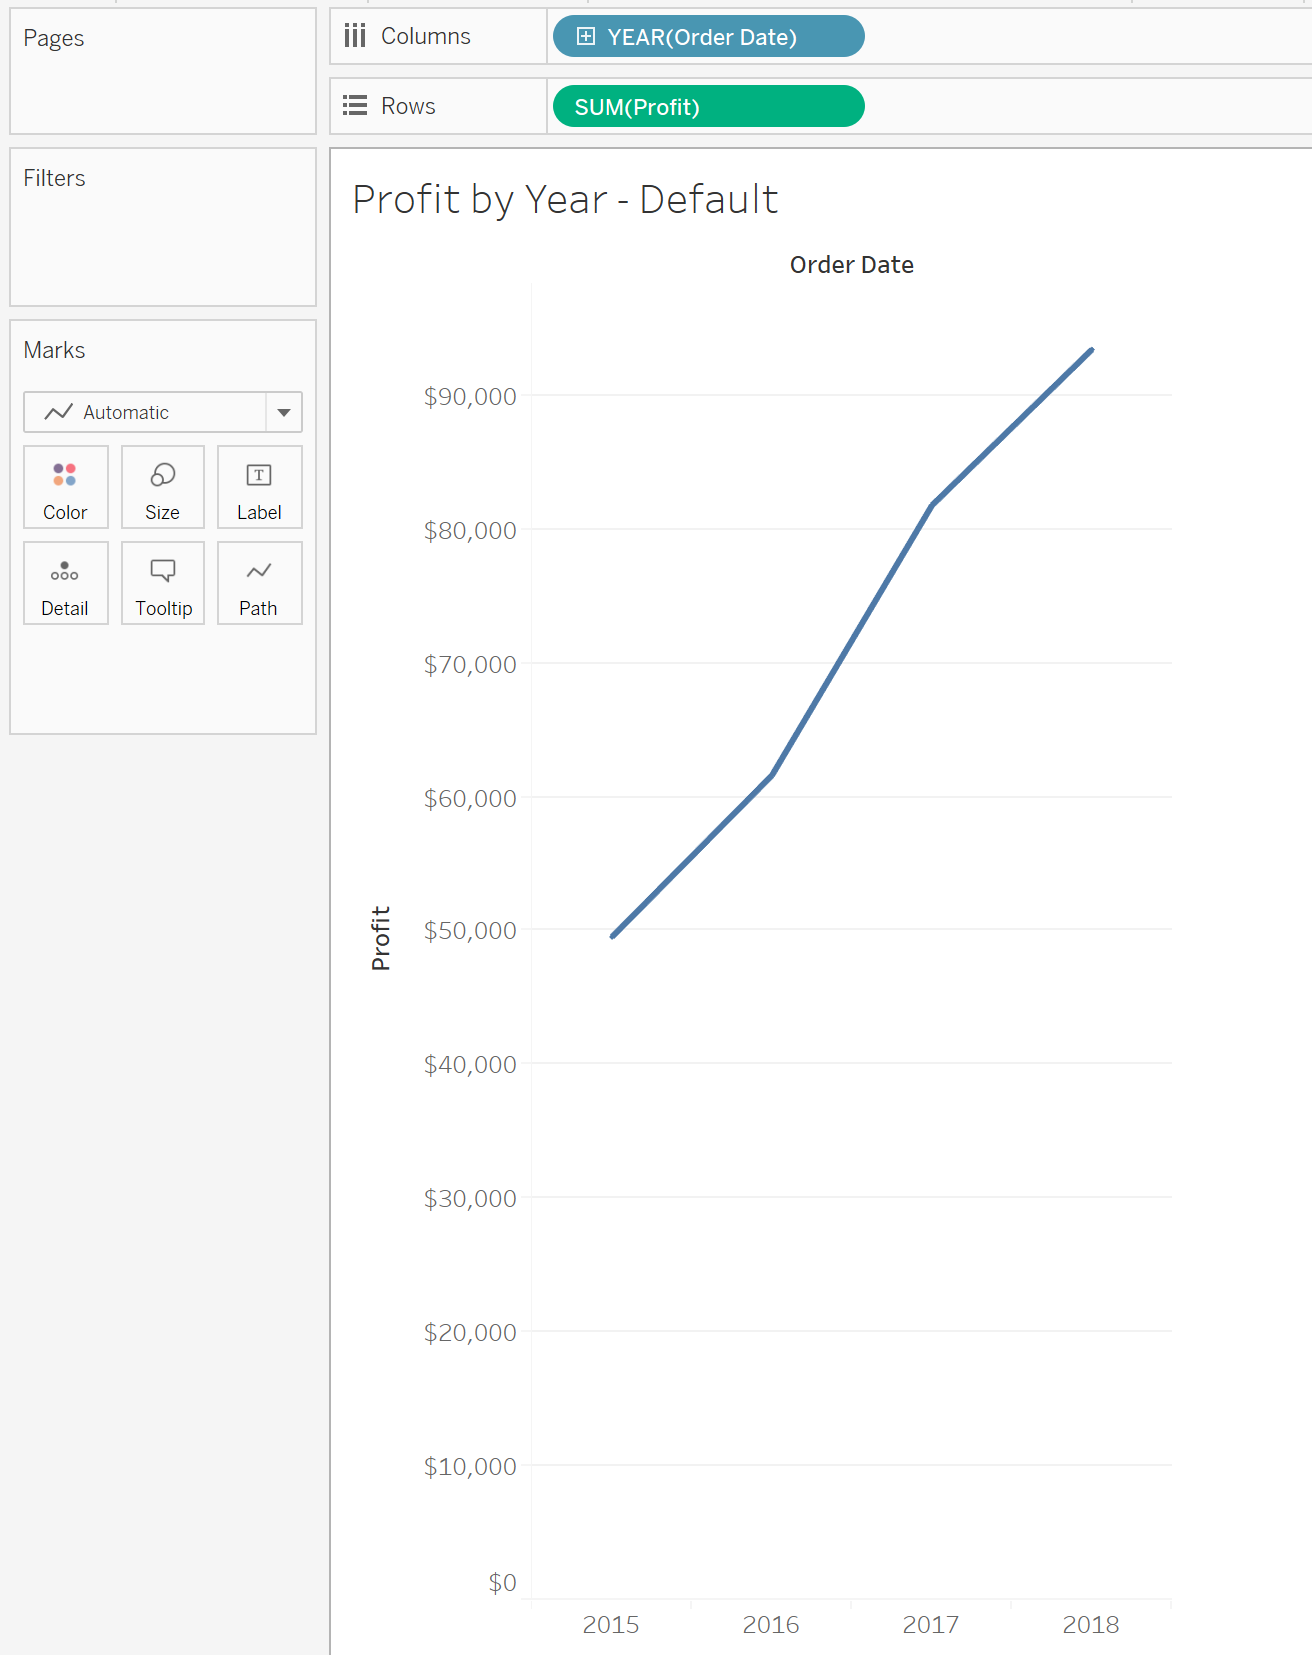
Again, the labels default to the bottom of the view, while many other BI tools default to the top of the view. This can be especially difficult when a demanding manager is asking for you to “recreate an existing report, exactly matching what we had before.”

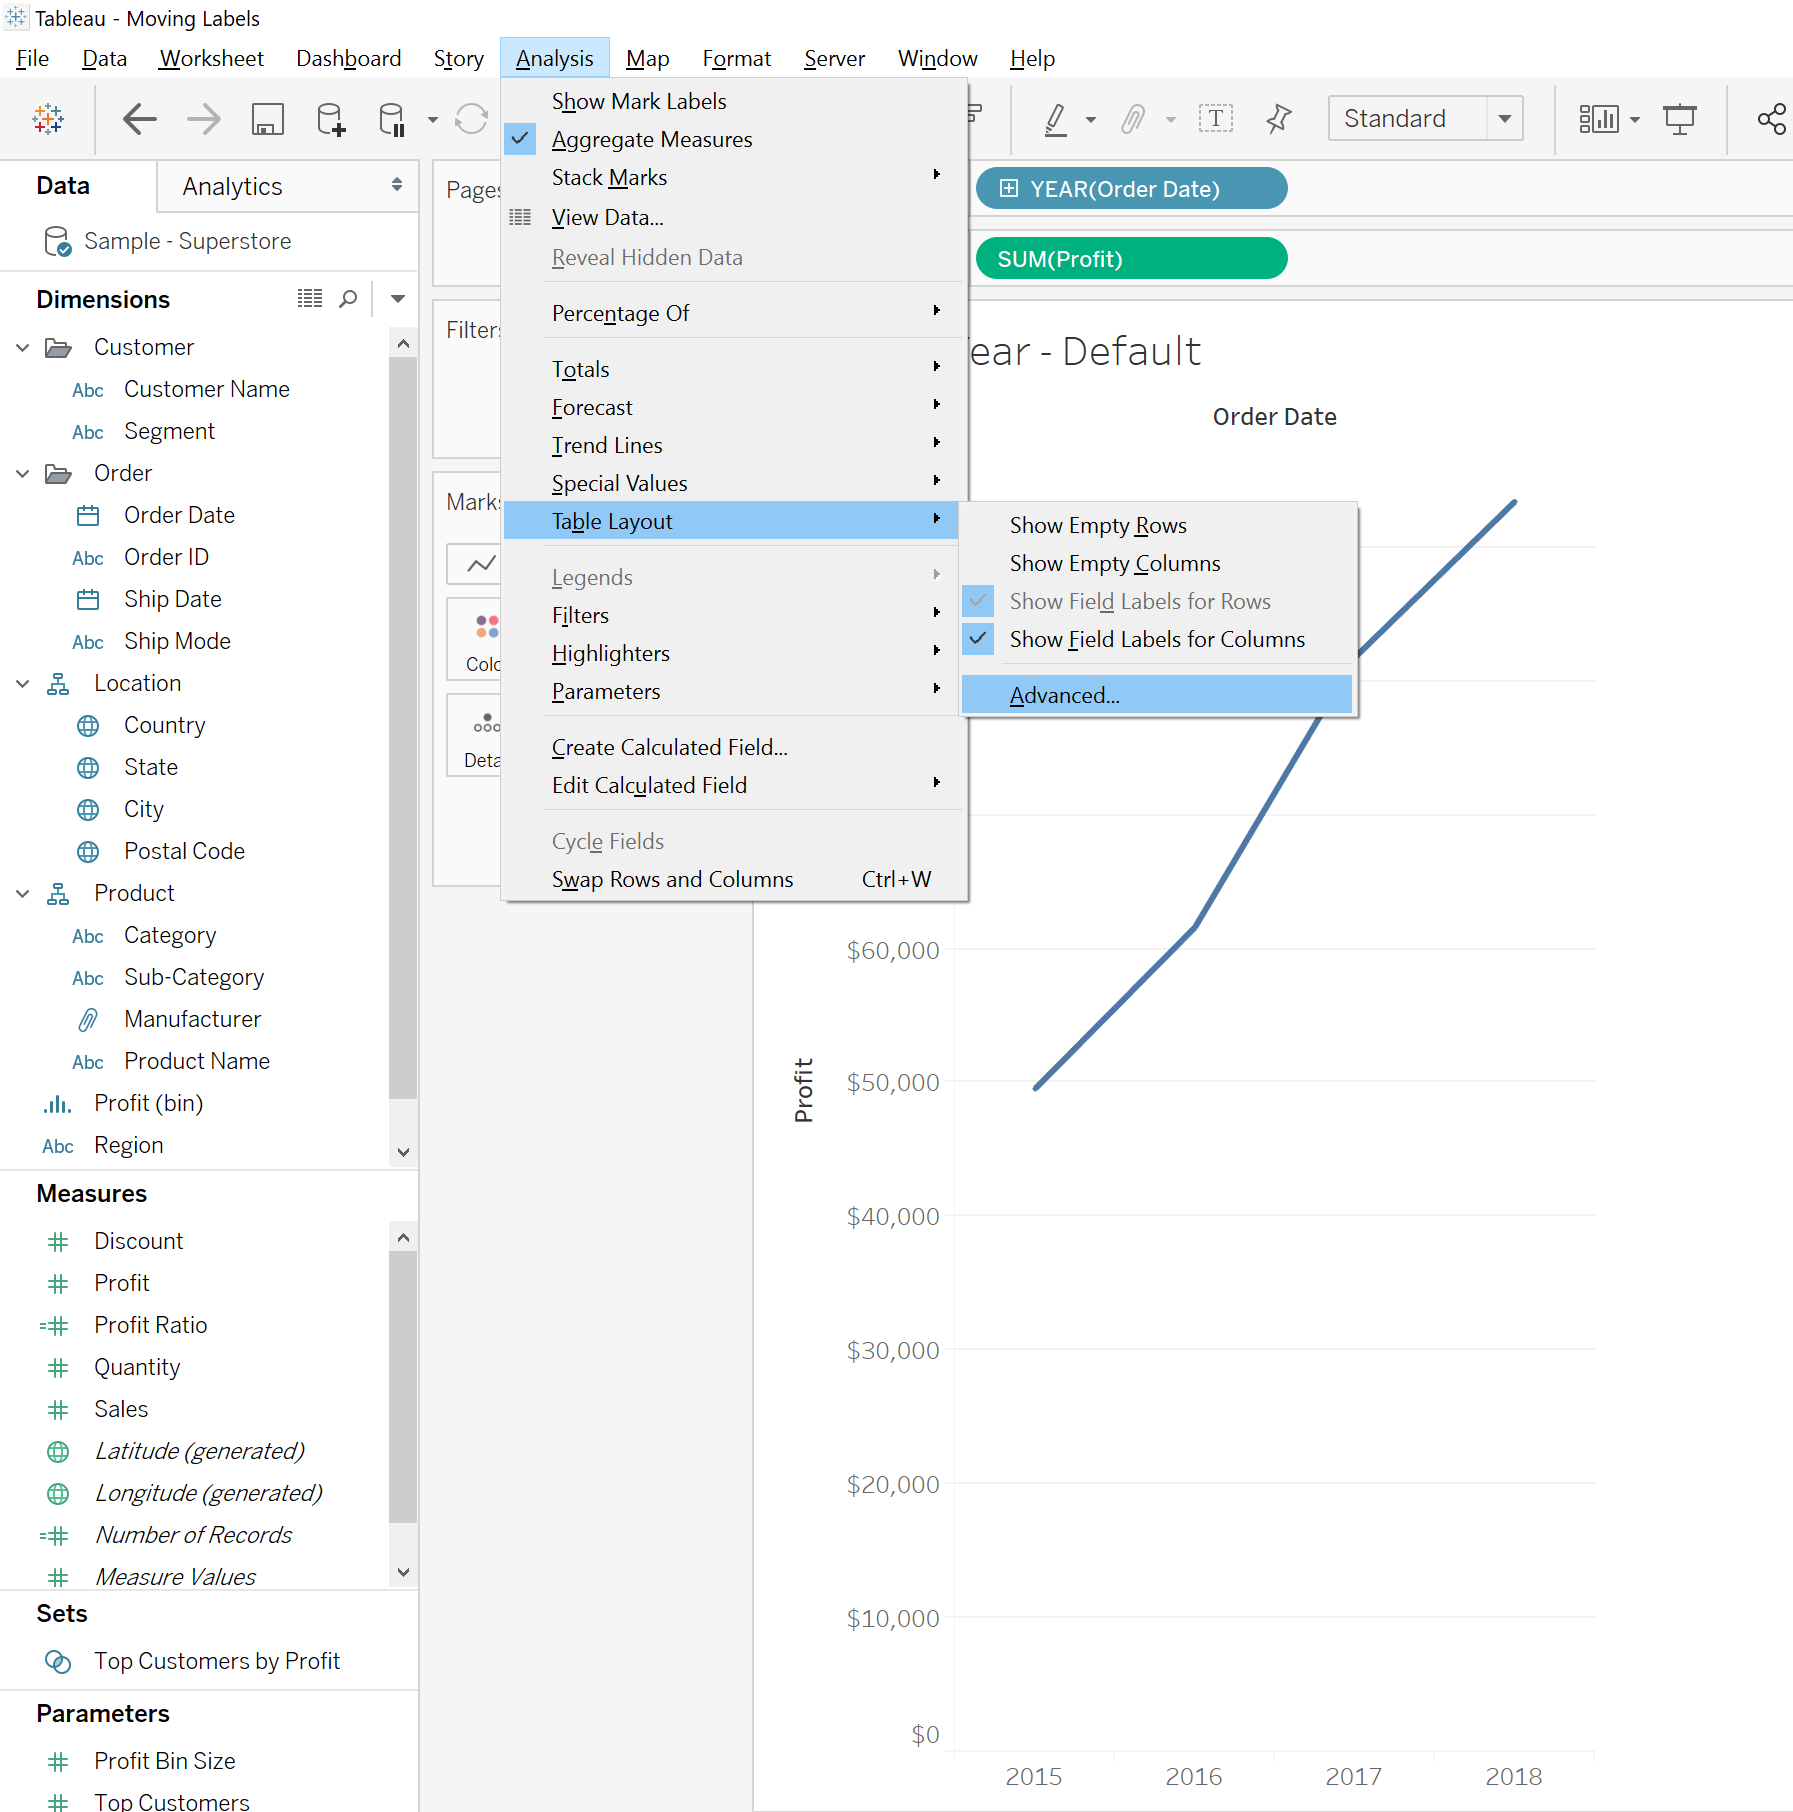
Luckily, the fix to this is quick and easy, though somewhat tucked away in Tableau’s menus. To change the location of the labels, go to Analysis > Table Layout > Advanced, as shown in the screenshot below:

moving headers to the top of view in Tableau

Once there, the box we are interested in is right under the Columns section:

moving headers to the top of view in Tableau

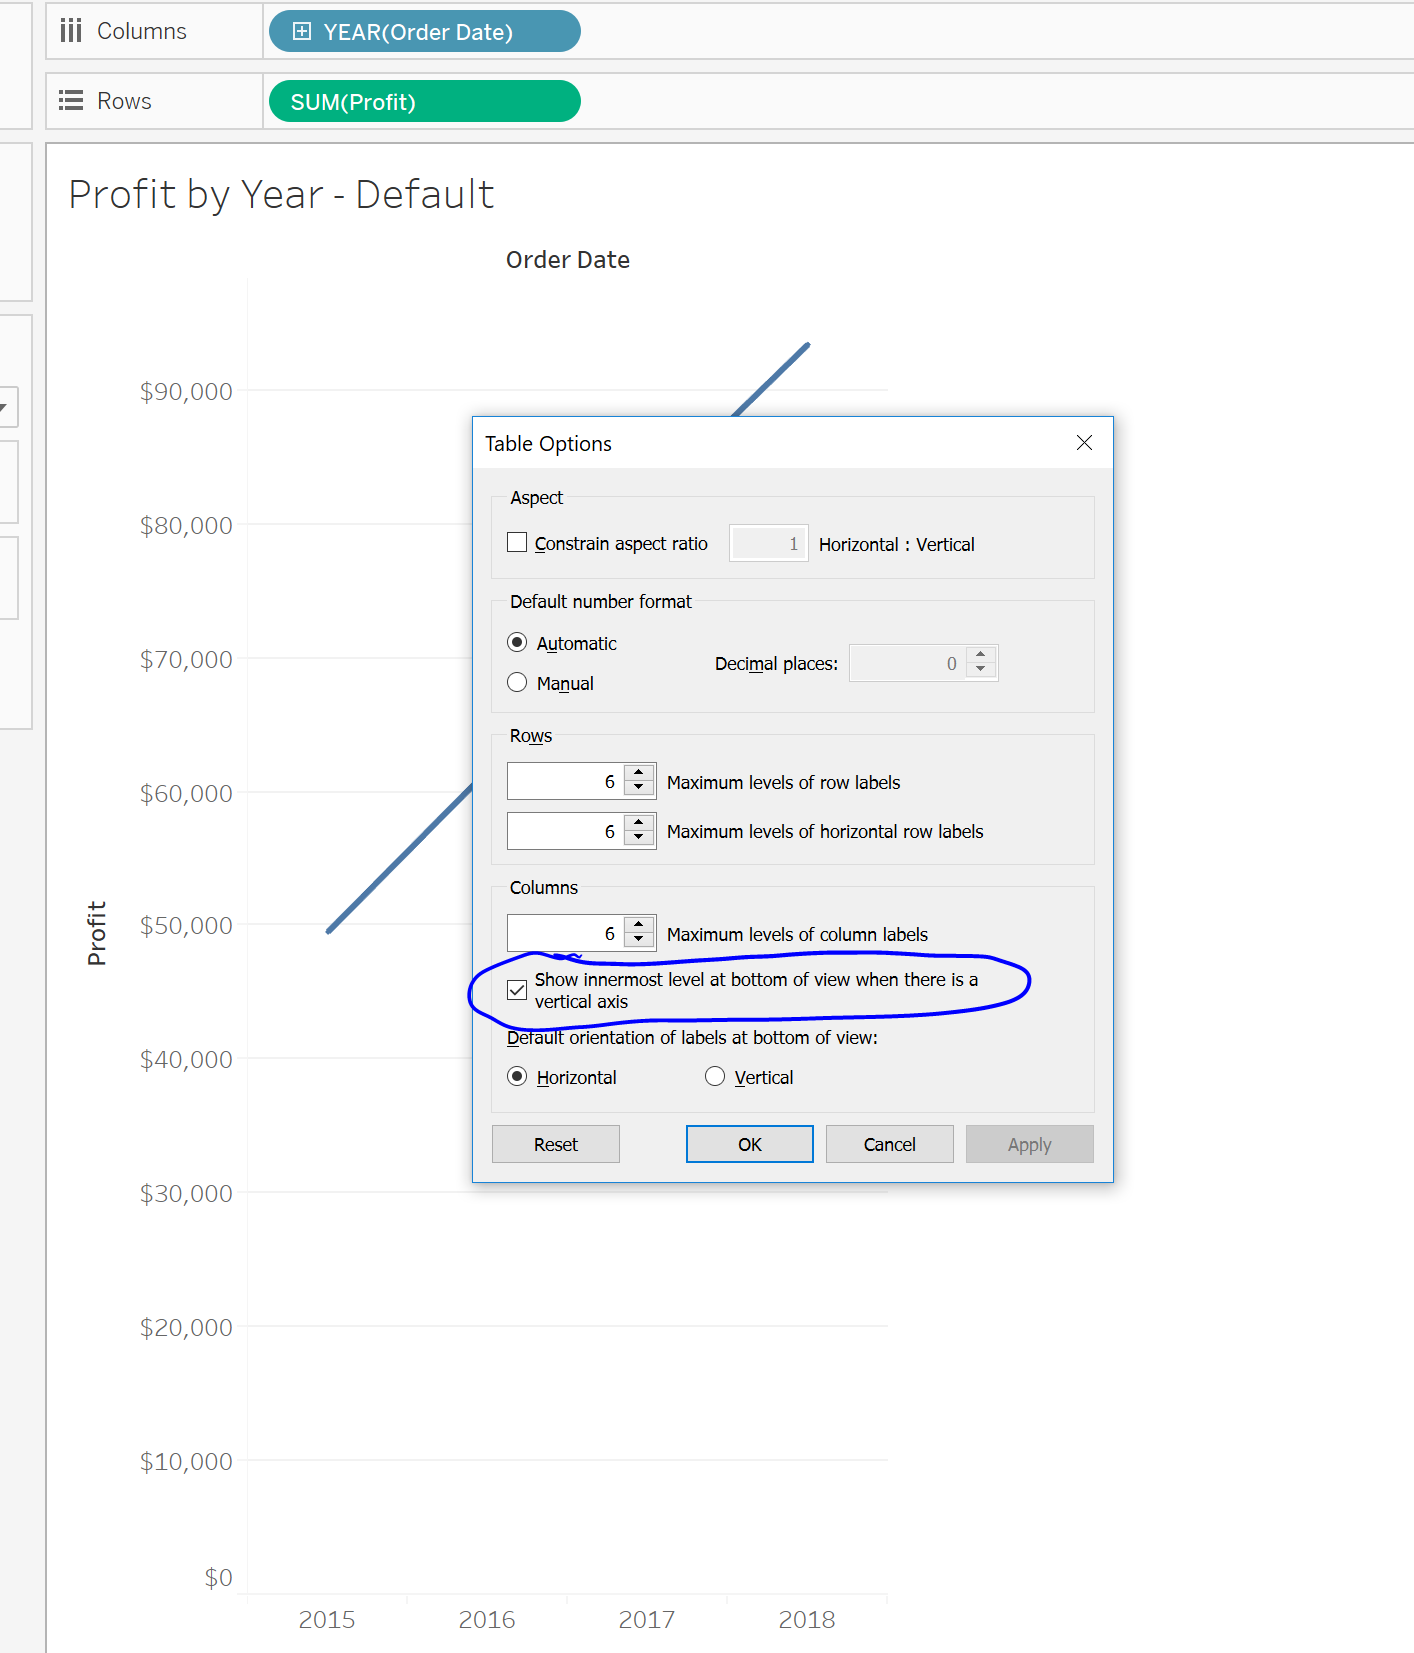
Uncheck this box, click OK, and voila!

moving headers to top of view in Tableau

Returning to our original view and following the same steps yields the same result:

moving headers to the top of view in Tableau

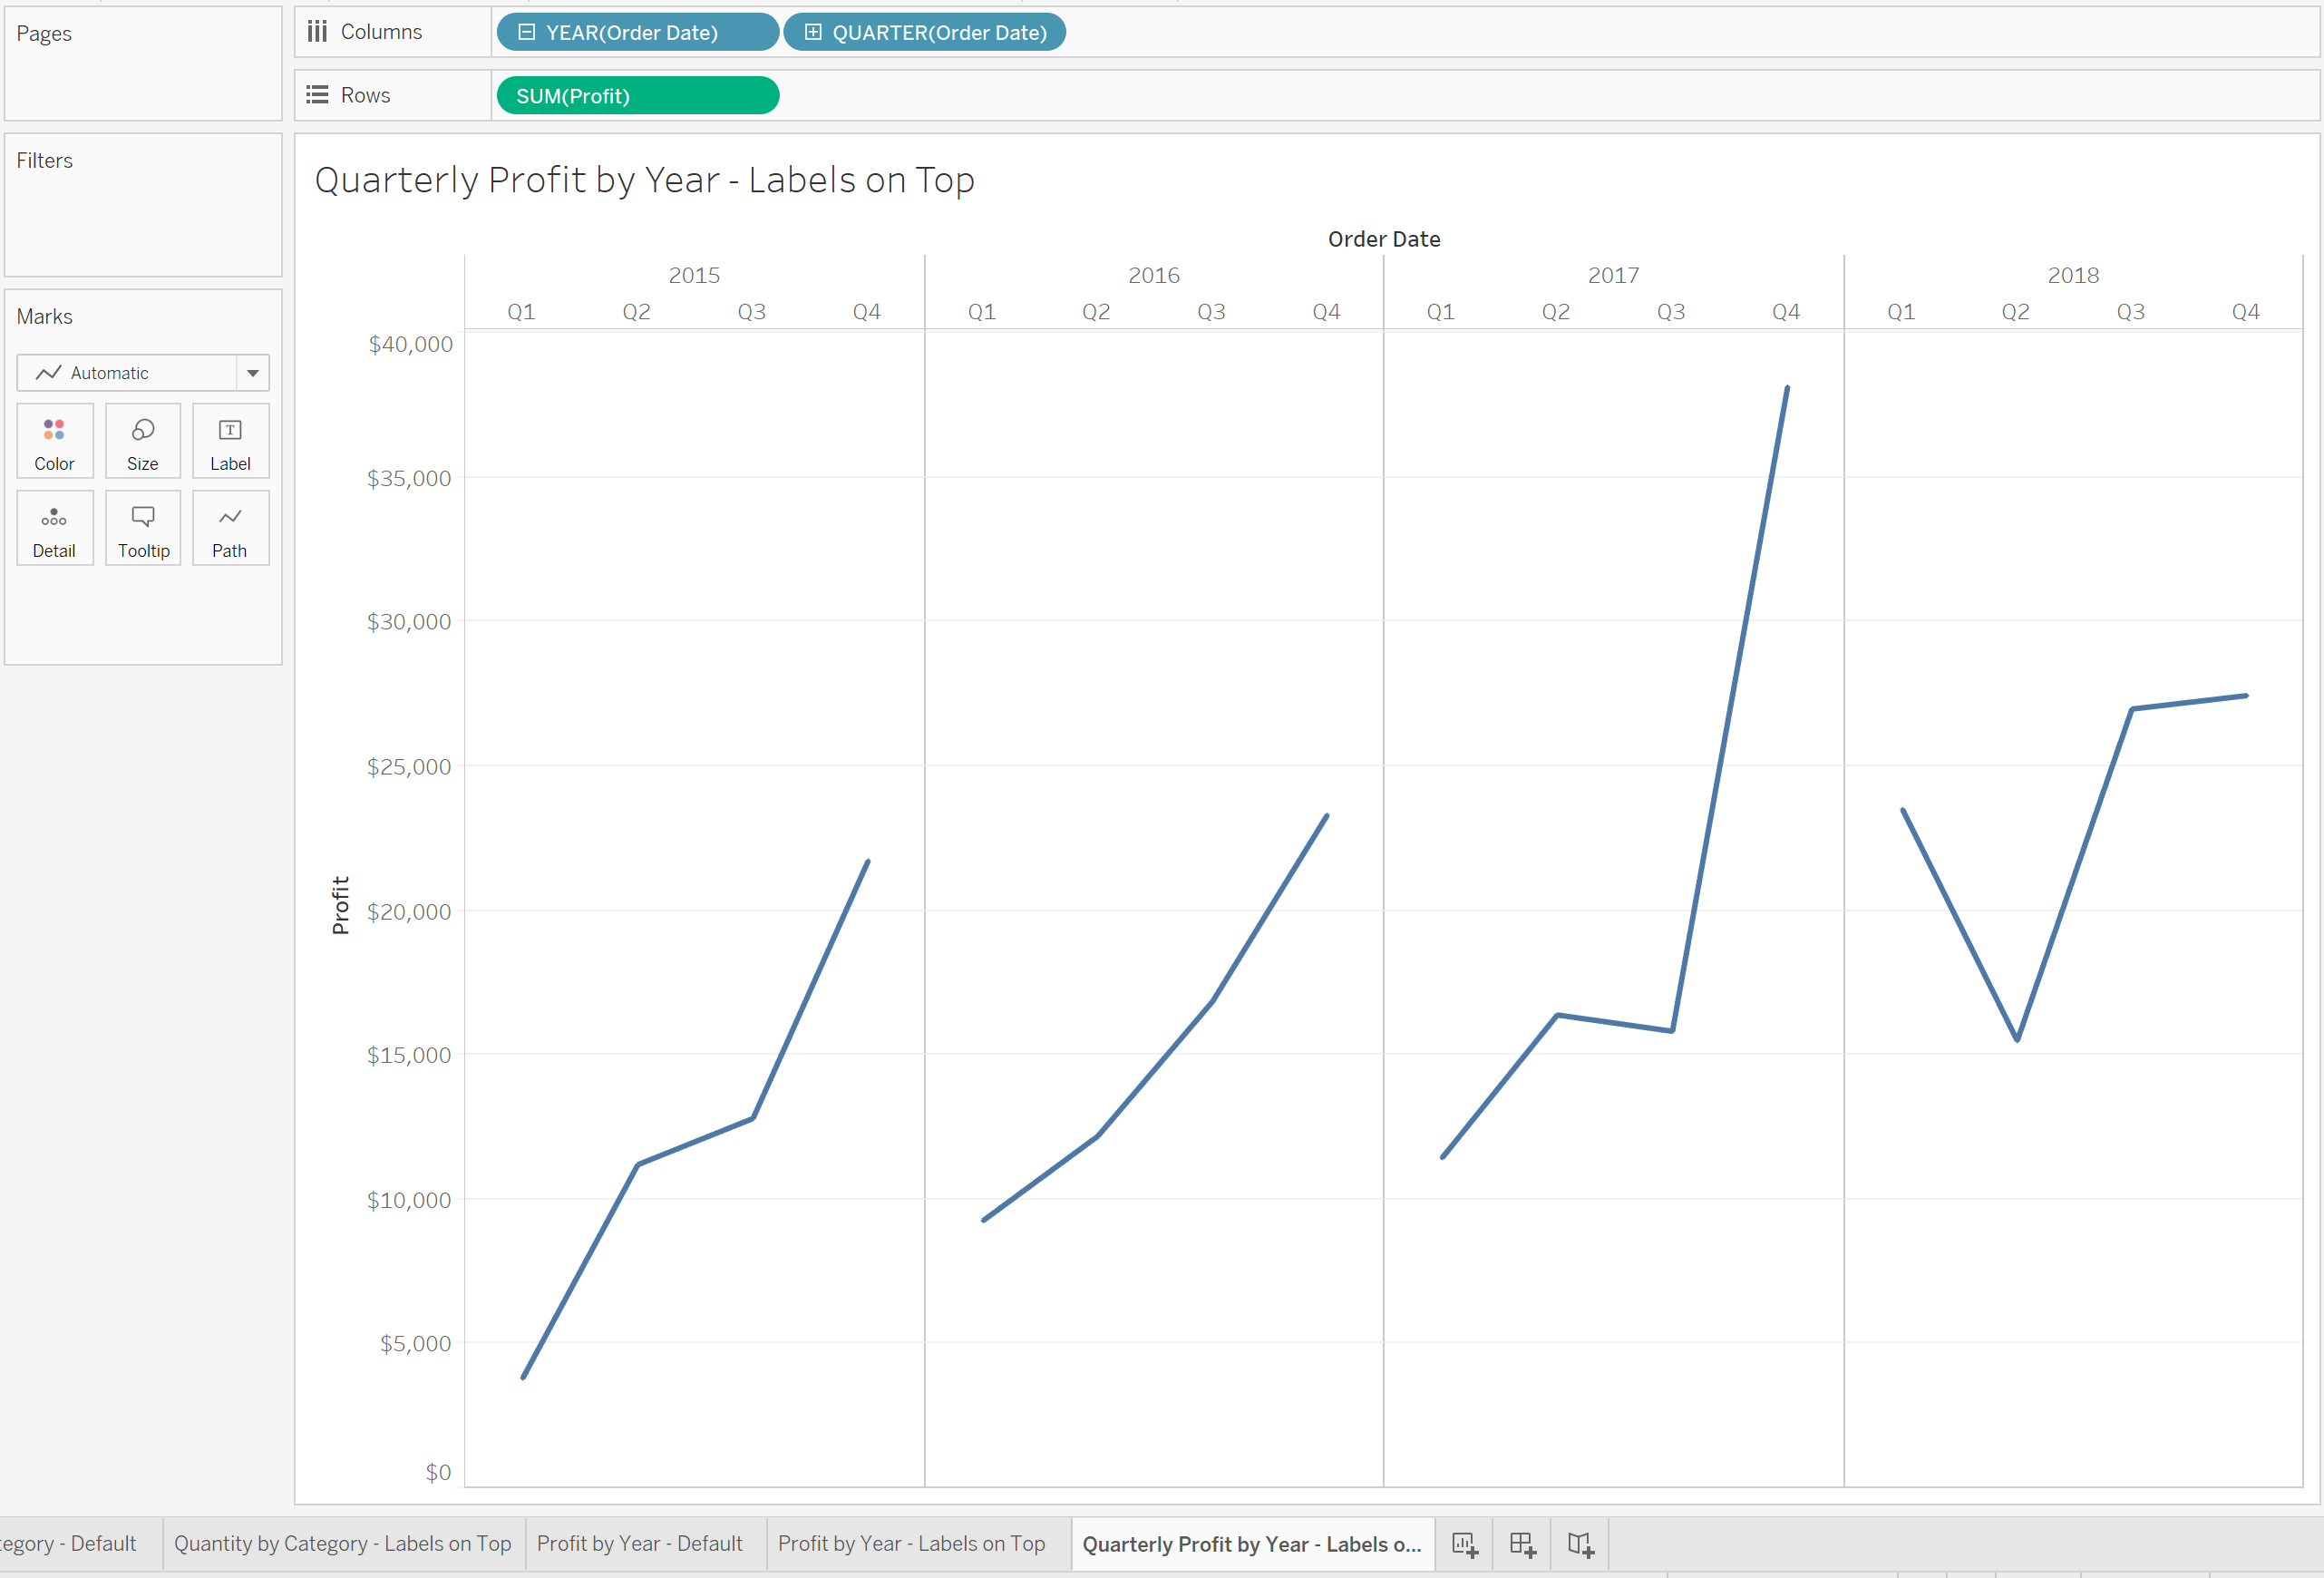
It is important to note that this setting will persist, even as you add more discrete pills to your view (thereby adding a header to your view). For example, if we drill in to the Quarterly Sum of Profit, all our labels will still be on the top of the view:

moving header to top of view in Tableau

In the end, adoption is a long process with many different steps, reports and visuals along the way. Hopefully, with this setting now available to you, you’ll be able to help either yourself or your organization feel more comfortable with, and excited about, the power and potential of Tableau.

If you’d like, you’re free to download the workbook on Tableau Public and see the technique in action.

Want More Questions from Tableau Training

  1. Questions from Tableau Training: Quick Filter Interaction
  2. Questions from Tableau Training: Labeling with Table Calculations
  3. Questions from Tableau Training: Speeding Up Presentation Views when Using Tableau
  4. Questions from Tableau Training: Dashboard Actions
  5. Questions from Tableau Training: Business Day Calculations
  6. Questions from Tableau Training: Adding Gaps Between Bars
  7. Questions from Tableau Training: When to Pivot Data in Tableau
  8. Questions from Tableau Training: Adding Conditional Formatting
  9. Questions from Tableau Training: Setting Weekday Start
  10. Questions from Tableau Training: How Do ZIP Codes Work in Tableau?
  11. Questions from Tableau Training: The Small Grey Bar Within a Quick Filter
  12. Questions from Tableau Training: Matching Mark Color
  13. Questions from Tableau Training: Showing the Null Indicator
  14. Questions from Tableau Training: Can I Manually Set the Colors of a Stepped Gradient?
  15. Questions from Tableau Training: How Can I Get Box Plot Data into a Crosstab?
  16. Questions from Tableau Training: How Do I Clear a Worksheet? Make a Copy?
  17. Questions from Tableau Training: Opening URL Actions Inside of a Dashboard
  18. Questions from Tableau Training: Can I Move Mark Labels?
  19. Questions from Tableau Training: How Can I Use My Current Report to Create a Viz?
  20. Questions from Tableau Training: Can I Create Text Hyperlinks on a Dashboard?
  21. Questions from Tableau Training: How Can I Transform My Crosstab into a Flat List?
  22. Questions from Tableau Training: Labeling the Top N
  23. Questions from Tableau Training: How Can I Customize Charts with Parameters?
  24. Questions from Tableau Training: Combining Measures into a Single Line
  25. Questions from Tableau Training: How Can I Create Custom Color Palettes?
  26. Questions from Tableau Training: Can a Top N Parameter be Nested Within Other Fields?
  27. Questions from Tableau Training: Conditional Scope on Tableau Calculations
  28. Questions from Tableau Training: Top Ten Plus N
  29. Questions from Tableau Training: Dynamic Label Positioning
  30. Questions from Tableau Training: Using Cross Joins to Solve Active Tickets
  31. Questions from Tableau Training: Top N Highlight Table
  32. Questions from Tableau Training: How to Use Specific Dimensions in Table Calculations
  33. Questions from Tableau Training: Moving Reference Line Labels
  34. Questions from Training: Comparing Metrics for Same Weekday in Previous Year
  35. Questions from Tableau Training: Colouring Specific Columns and Rows in a Crosstab
  36. Questions from Tableau Training: Creating a Custom Legend as a Sheet
  37. Questions from Tableau Training: How Can I Draw a 45-Degree Angle?
  38. Questions from Tableau Training: Down the Aggregation Rabbit Hole
  39. Questions from Tableau Training: Percent Change from Previous Period on a Map
  40. Questions from Tableau Training: Union File Names as Years
  41. Questions from Tableau Training: Conditional Coloring on Sparklines
  42. Questions from Tableau Training: Moving Column Headers to the Top of the View
  43. Questions from Tableau Training: Isolating Rank with Parameters and Calculations

More About the Author

Ben Young

Strategy Director, Americas
Questions from Tableau Training: Moving Column Headers to the Top of the View “Tableau is an Excel complement, not an Excel replacement.” Whenever I teach a training class, I make this point multiple times ...
How to Create Bins on a Histogram in Tableau (Note: This post is an expanded version of an article I originally posted on the Tableau Community Forums prior to joining InterWorks.) ...

See more from this author →

InterWorks uses cookies to allow us to better understand how the site is used. By continuing to use this site, you consent to this policy. Review Policy OK

×

Interworks GmbH
Ratinger Straße 9
40213 Düsseldorf
Germany
Geschäftsführer: Mel Stephenson

Kontaktaufnahme: markus@interworks.eu
Telefon: +49 (0)211 5408 5301

Amtsgericht Düsseldorf HRB 79752
UstldNr: DE 313 353 072

×

Love our blog? You should see our emails. Sign up for our newsletter!