The Tableau Performance Checklist series is designed to help you streamline your dashboard performance and Tableau Server configuration. Each post expands upon one item listed in the master Tableau Performance Checklist. As of 2024, you can find an updated Tableau Dashboard Performance Checklist here.
In our last guideline, we’ll revisit another tip on how your dashboard’s layout can impact performance:
“Fix dashboard size relative to end-user consumption. Automatic sizing is less efficient than specifying dashboard size.”
It’s not all about size … though I’ve heard it’s mightily important.
Automatic Sizing
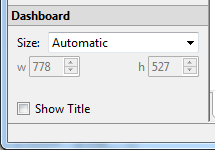
There is a setting for size in the bottom left-hand corner of your dashboard. This drop-down allows you to specify the height and width dimensions of your dashboard when it is served up by Tableau Server:

Selecting the Automatic option on the Size drop-down menu means that Tableau will automatically scale the dashboard to fit each viewer’s screen or window when it is served. Automatic scaling does present some unpredictable results when it automatically scales in terms of appearance, but the big problem lies with performance.
Tableau Server will remember every size of a dashboard that it renders so that dashboard can be faster the next time it gets served up. So, if twenty people are all viewing the dashboard at slightly different sizes, then Tableau Server will consider this dashboard to be twenty different dashboards.
Ouch.
Fixed Sizing
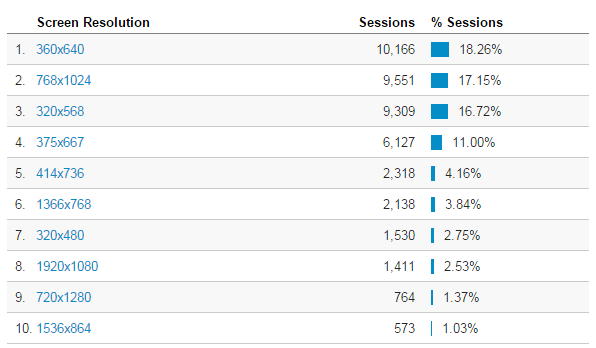
The solution to this problem is twofold. First, you need to understand how your users are viewing your dashboard. An easy way to find this is to use an analytics program to get some of the basic demographics of your viewers’ profile, such as a screen resolution. Google Analytics is quite capable of this task and it’s offered for free by Google.

In the above example, you can see that our users are coming in on a large variety of devices. The more you can pinpoint your tracking to your report consumers the better. Let’s try to accommodate three different audiences – mobile phone users, tablet users and computer users.
For mobile phone, a resolution of 320×568 will cleanly display our visualization (without scrollbars) to over 50% of our users. For tablet users, we’ll go with a 768×1024 display (18.52%). Finally, for our computer users, we’ll use 1366×768 (7.4%).
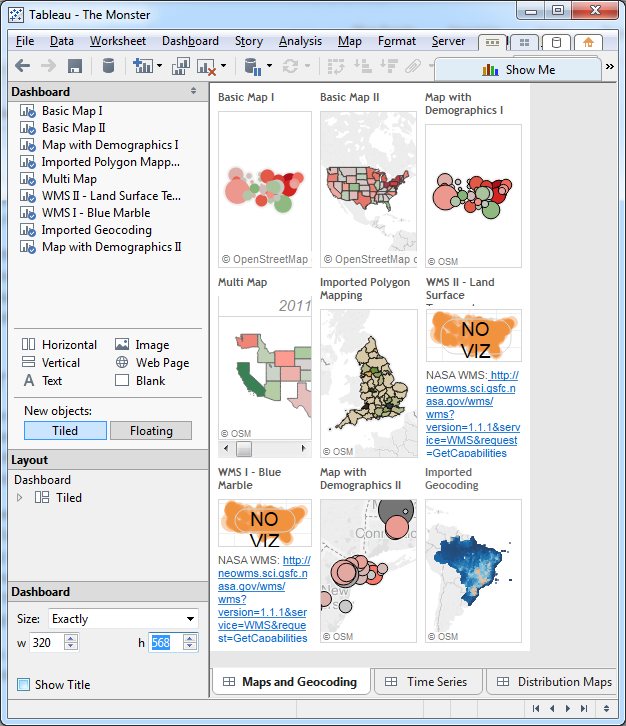
Once you have some idea of which screens to plan for, revisit the size setting on your dashboard and select the option that best fits the size that you need. Or you can choose the Exactly option and enter the height and width yourself to a pixel level:

As you can see, Tableau will automatically adjust the dashboard in the canvas area to conform to the size needed, this helps you as the developer to understand how the dashboard will look to the interactors on Server as well as its contents and how its contents sits within the window. To produce the other sizes we need, simply Copy Sheet, Paste Sheet and adjust the new size.
It may seem like a little extra work to create three versions of the same dashboard, but it will save Tableau Server a lot of unneeded work over Automatic sizing. This will, in turn, help performance as a whole on the server. By anticipating the most common sizes and fixing your dashboards and visualizations to those limits, you’re taking a considerable amount of work off of Tableau Server.
If your Tableau is published through a portal, always contact the portal owners to determine what your window limits may be. In many instances, this is the determinant size required. Should Tableau be relatively new to your business, consider contacting your internal computer hardware suppliers to determine the hardware (desktop/laptops/tablets) distributed within the business. You may find the majority of users are assigned the same model of laptop, and you can use this as a good guide for initial dashboard sizing.
Always test different sizes on different media devices. Don’t assume that the sizing is correct without a full test prior to production.
Mastering Best Practices
If you’re interested in becoming a Tableau Server guru, then learning these performance best practices is essential. Check back frequently as we add new posts and dive deeper into each point in the Tableau Performance Checklist.
Another great way to identify best practices is to leverage the insights offered by our Performance Analyzer, part of Workbook Tools for Tableau. It will examine all of your workbooks, worksheets, dashboards and data sources against a list of best practices to ensure that you’re using all the tips and tricks to guarantee your visualizations are moving at light speed.
As always, feel free to get in touch with us if you have any questions regarding performance or anything Tableau related! We’d be happy to help.

