
We have all had a tough year. To round it out, we invited a bunch of our clients in Australia and throughout Asia Pacific to take part in an exclusive hackathon, run over 12 days in the lead-up to Christmas (hence the name). Thank you to all of you for taking the time of out of your busy schedules to participate and for sharing your enthusiasm and fantastic work!
Hopefully, all the participants had some fun, gained experience with some new datasets and maybe even got some ideas to implement in your day jobs next year. And now, the moment has finally come to reveal the winners! These fantastic people are taking home some great prizes and bragging rights. But before we do, let’s get a recap of this amazing journey.
You Did What?!
The Hackathon ran over 12 days, from 3 December (data provision) to 14 December (judging day). Contributors organised themselves into individual contributors or teams (as small or big as they liked), chose one of four datasets (climate change, movies, music or Marvel comics) and spent a bit over a week coming up with something awesome.
We sent out tips along the way, including links to some fantastic InterWorks blogs and other favourites from our Hackathon team (resources below). Eleven days later, dashboards and visualisations came flying in, and on day 12, we put our judging hats on. We had several categories for participants to choose from, including a wildcard for the crazy among us. Check out the categories below.
- Best Business Dashboard – Think clean design and simple stories. Clear KPIs, great chart choices, clean and easy navigation, maybe some neat interaction.
- Best Viz – Think beauty. Heavy focus on design and storytelling and the tools and techniques used along the way.
- Great Insight – Think data discovery. We’ll be focusing on the analysis done, and the story you tell for your cool insight.
- Wildcard – None of the above, just super cool.
And the Winner Is…
This was super hard. We ended up giving out five awards against three of our categories – two in best viz (one group and one individual), two in wildcard (one group and one individual) and one for great insights.
Best Viz
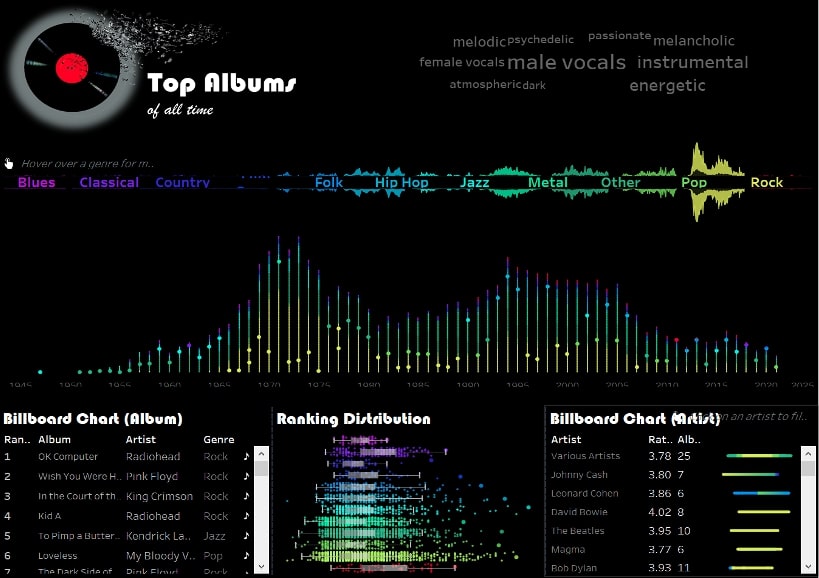
The Best Viz Award for a group went to Top Albums of All Time by Andrew Dawson and Jennifer Battley from Fortescue Metals Group Ltd. We loved this viz for its great colour, chart choices and inspired design, all of which was super on theme. Also, who knew that the ‘70s was the peak of rock?! (We do now!) Well done, team! Check it out on Andrew and Jennifer’s profiles:
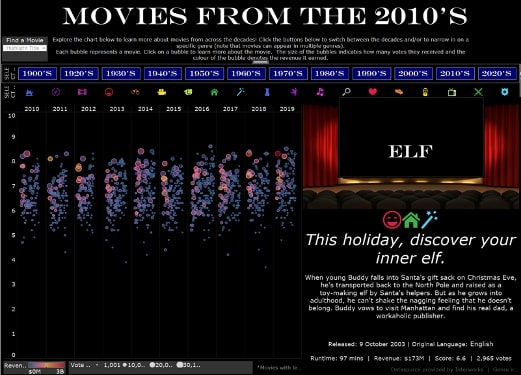
For the individual, the winner was Movies by Decade and Genre by Penny Privett from the Australian Football League. We loved the beauty and interactivity in this one – choose a decade, style and even a specific movie on the dot viz, and get some great insights into individual films. Well done, Penny! Check out Penny’s movies dashboard on Tableau Public – maybe you’ll get some inspiration for the weekend:
Great Insight
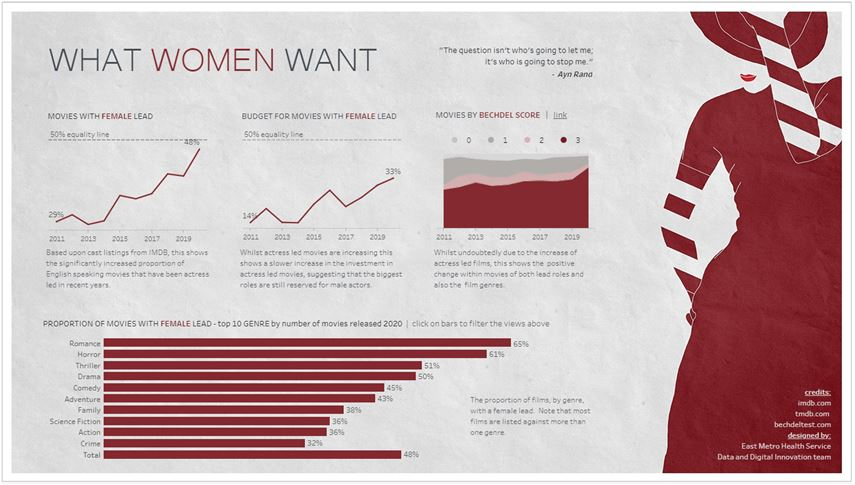
This award goes to What Women Want by Jane Mamas, Tommy Harstrom, Richard Holley, Colin Mather and Gary North. We loved the insights in this dashboard and spent a while exploring how different genres differ on things like the proportion of female leads and Bechdel scores. Particularly saddening were the low scores for sci-fi (Beth’s favourite genre) – lots of room for improvement there. Interact with the dashboard on Tableau Public:
Wildcard
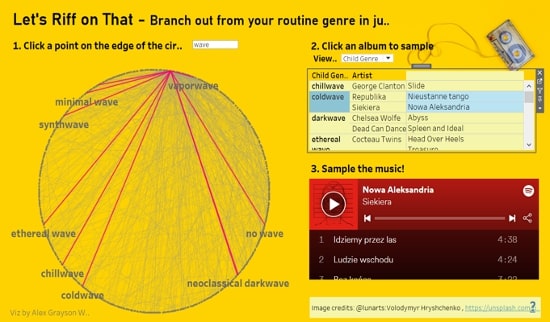
The individual award in the Wildcard category goes to Let’s Riff on that by Alex Grayson-Widarsito. This was a super fun dashboard to play with and had our team jiving away for several days. Choose your genre, find an album, and get some great tunes all without leaving Tableau; or head to Spotify and kick off a longer list of tunes. Fun times! Check out Alex’s music dashboard on Tableau Public:
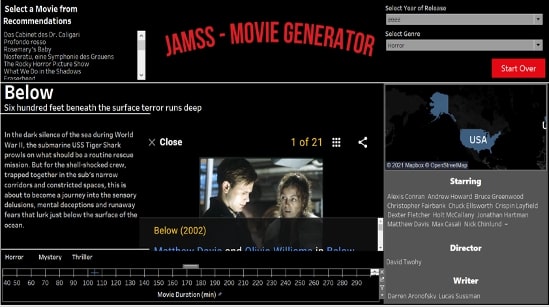
The group award in this category goes to JAMSS Movie Generator by Chiu-San Chen, Janice Wong, Mayur Mittal, Angela Jenks and Sunny Singh. Another great recommendation generator, this one helped a few of us get some inspiration for our next movie binge. Choose your genre and key success item (e.g., length of film / high rating) and get a bunch of recommendations, which you can then click through for more info. Thanks for the watchlist, team! Check out JAMSS’s movie dashboard on Tableau Public:
Honourable Mentions
Before we wrap up, we also have a lot of honourable mentions. These fab entries definitely deserve a moment of recognition all their own! Shoutouts to the following dashboards and their brilliant creators:
- Movie Tag Line Quiz by Jason Maloney and Team from HBF (Ellie Balson, Aanchal Shukla, Cesar Gonzales Mathews, Jake Parkin, Omar Hafez, Smit Shah, Steven Lin, Tracy Mclean, Parastoo Razavi, Claire Aindow, Andrew Lindon and Lisa Lee)
- Top 5000 by Sarah Mullock
- The Greatest Music Decade by Philip Low from Bridgestone Australia Ltd
Tableau Dashboarding Resources
On each day of the competition, we sent participants tips and great resources. Check out the compiled lists below. Hopefully, you’ll get some inspiration and great ideas as well!
Inspiration to get your creative juices flowing:
- Designing Impactful Dashboards | InterWorks Webinar
- Tips from Zen Masters | Tableau Conference 2021 Session
Storytelling! Underneath every great dashboard or visualisation is a great story. Taking the time to explore the data and find the story, before getting fancy in Tableau, makes the difference between “okay” and “wow”.
- Telling Great Stories with Data | InterWorks Webinar
- Bland to Bold | Tableau Conference 2021 Session from InterWorks
- Storytelling with Data | Podcast
Tips for pulling off that cool functionality you’re chasing:
- 10 Things You Forgot You Could Do in Tableau | InterWorks Webinar
- Creating Device-Specific Tableau Dashboards | InterWorks Webinar
- Tableau Speed Tips: Shortcuts and Tricks for All Skill Levels | Tableau Conference 2021 Session
Cleaning it all up:
- Three Tips to Improve Tableau Dashboard Design| InterWorks Video + Resources
- Make it Better | Tableau Conference 2021 Session from the Flerlage Twins
- Small Changes, Big Impact | InterWorks Blog
- A Little Design Makes a World of Difference | Flerlage Twins Blog
Polishing the final UI / UX:
- Modern User Experience Design in Tableau | InterWorks Webinar
- Five Tableau UX Hacks for 2021 | InterWorks Webinar
- Interactive Dashboard Tips and Tricks | InterWorks Webinar
Get Involved
Can’t get enough of these tips? Would you like to be involved next time we host a hackathon like this? Reach out to the InterWorks team for more information on how we team up, including how you might be part of our next exclusive event.