
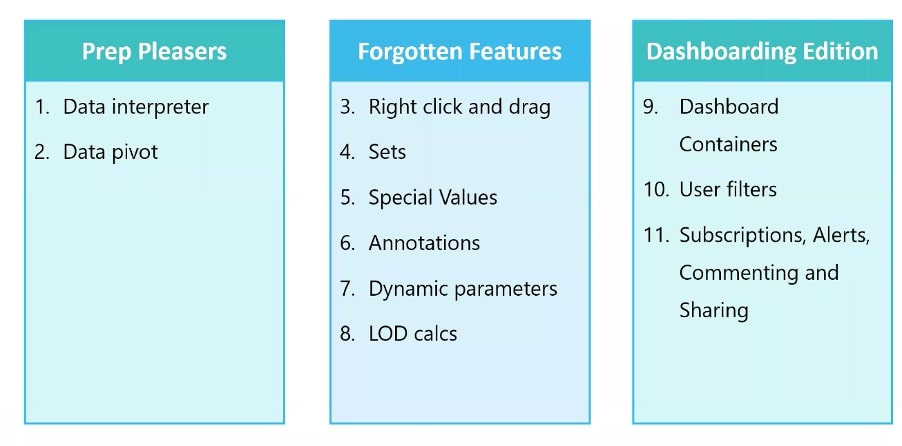
It’s easy to fall into the same old routine with Tableau, which is why we wanted to remind you (and ourselves) of some great tips and tricks that really can elevate your workbooks:
Tip 1 – Data Interpreter
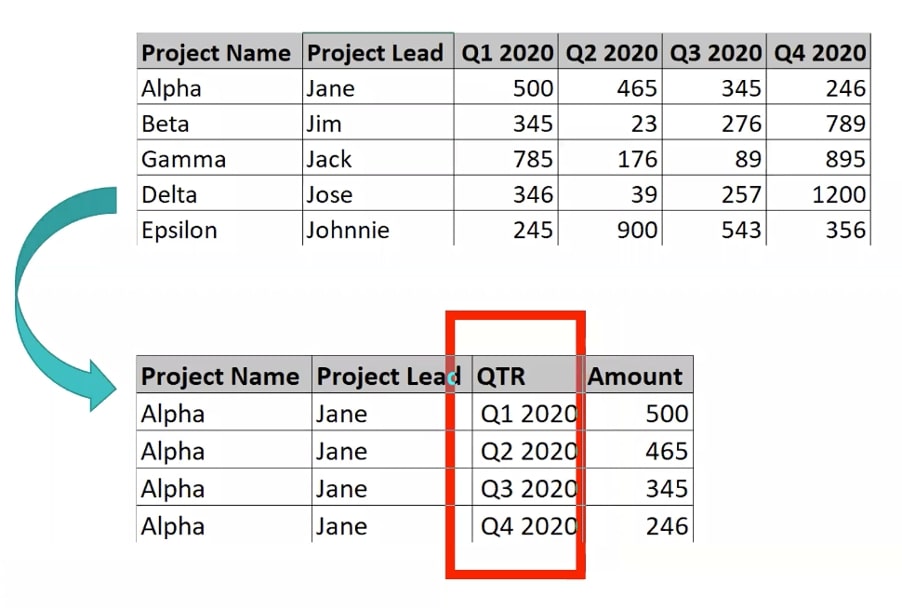
All Tableau Creators know that it all starts with the data, but we also know that data can be the bane of our existence. Additional columns, blanks, missing values … the list goes on. A great example of a common source of frustration is multiple headings:
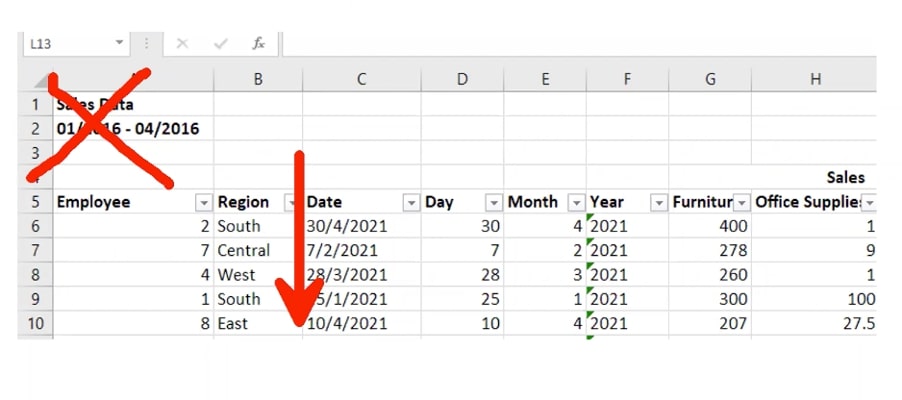
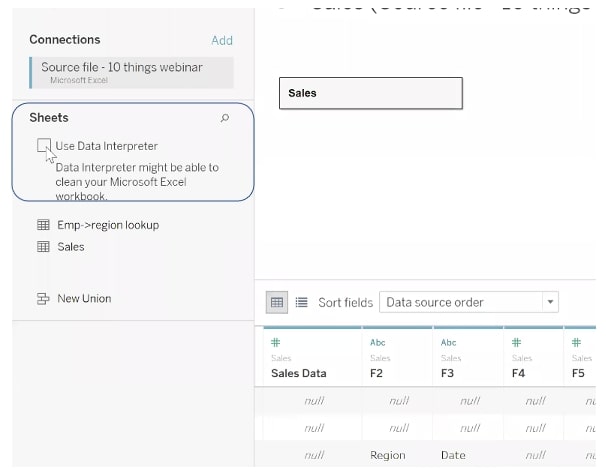
Tableau loves listed columns but not so much the multiple headings, so cleaning must commence before the work can begin. But this is where we can use Data Interpreter:
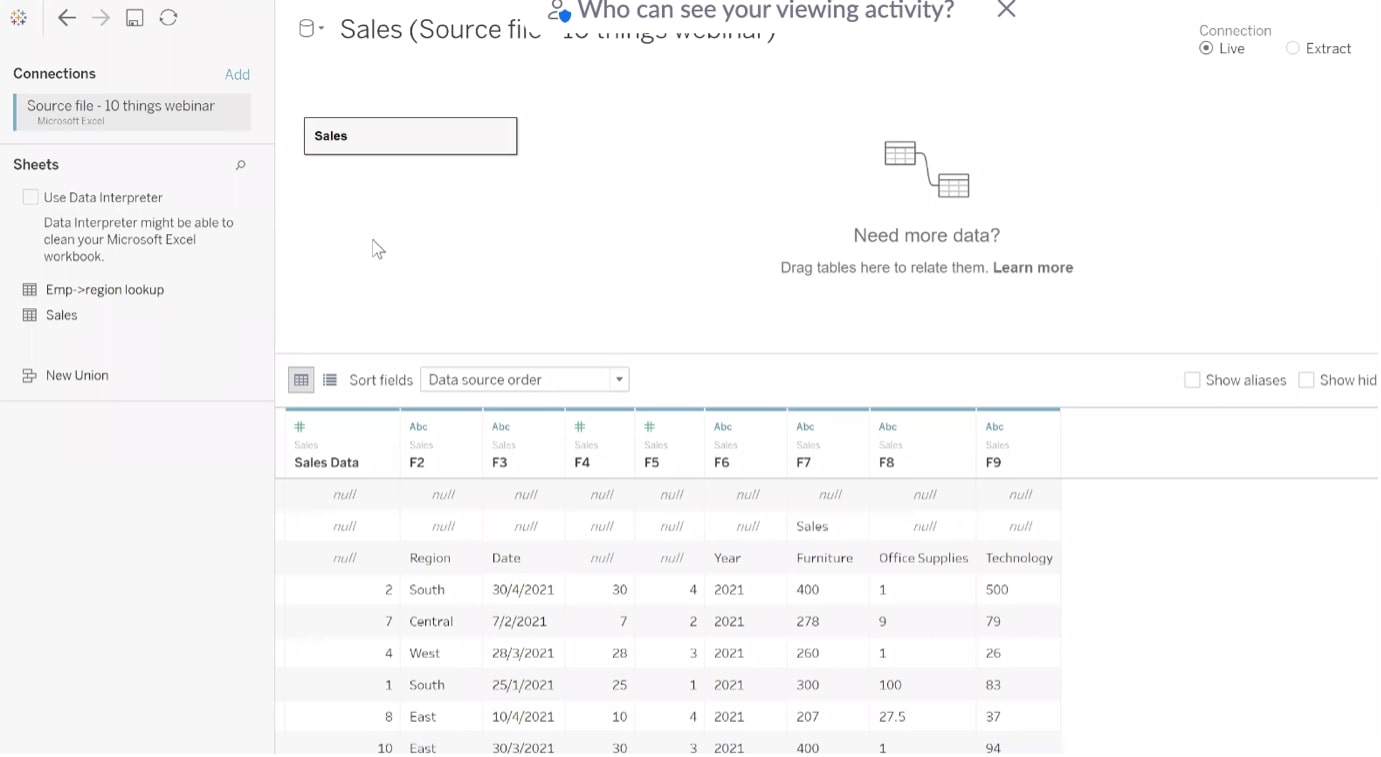
NOTE: This isn’t available for all of our data types within Tableau, so you may have to go into the original data source and clean it yourself:
By using the Data Interpreter, you can save yourself a lot of time and get straight to visualising.
Tip 2 – Data Pivot
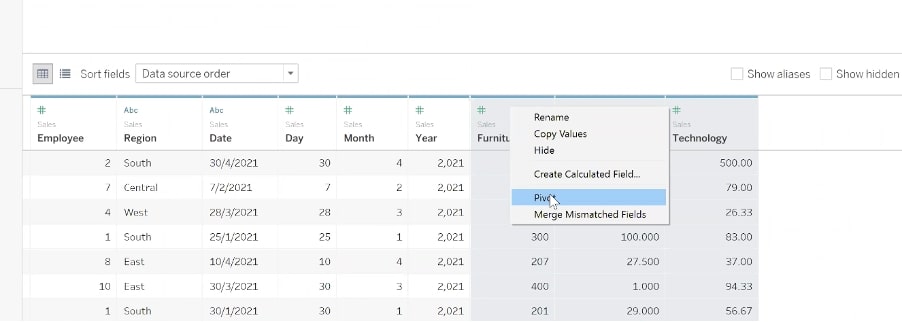
Tableau loves a column view, and with your sheet view, you can pivot your data to make it more condensed and easily build those visualisations:
Hit CTRL and select the headers that you would like to pivot, then right-click and hit the Pivot option:
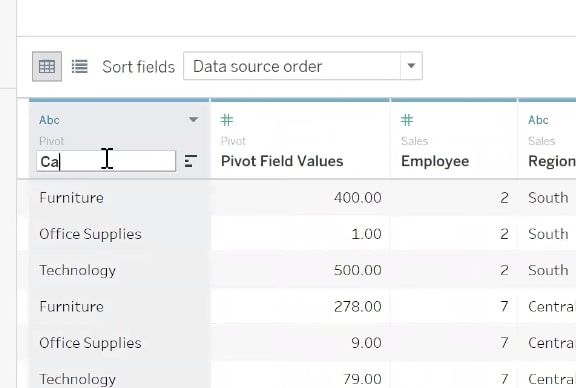
Whenever you pivot, you will see the data will move to the front of your import with the Pivot Field Names and Pivot Field Values. To fix that, just click on those headers to rename:
Now that we have done some preliminary data cleaning, it’s always recommended to go through and see how Tableau has interpreted the data we’ve imported. At times, it may not be right. Sometimes, numbers may not be required for analysis and would be more appropriately represented as a dimension, as is the case above with employee data. A simple fix: right-click on the # and simply change the data type.
Now that your data is clean and in Tableau, it’s time to get started and create your visualisations, which brings us nicely to those Forgotten Features.
Tip 3 – Right-Click and Drag
Simply put, a right-click and drag is the most efficient way to build out your workbooks. Why is this valuable? It will reduce the number of clicks required to create and it will reduce rendering, e.g. when dealing with a high cardinality dimension you want to aggregate – COUNT (customer name):
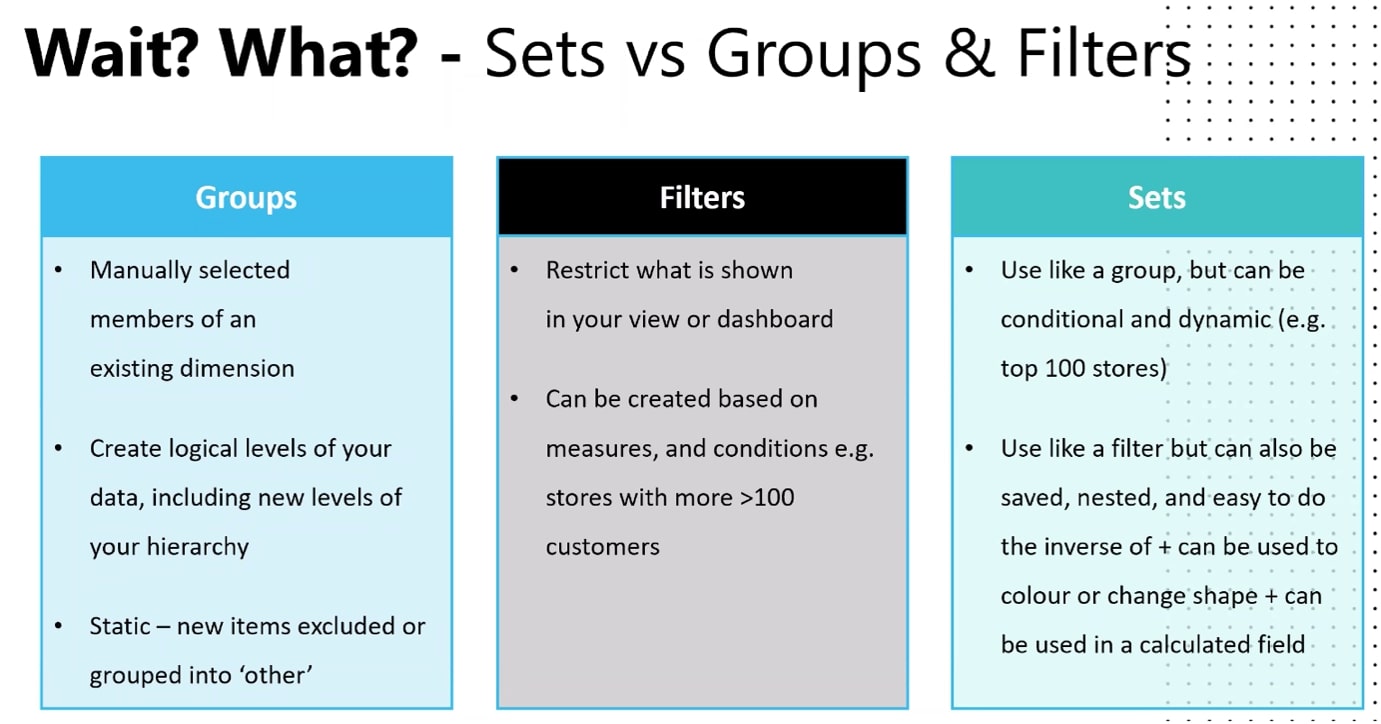
Tip 4 – The Ins and Outs of Sets
A set allows you to create a group of data that can be used as a sub-set to help you analyse your data more carefully. What’s great about a set? It can be dynamic, meaning that as your data is fed into Tableau live, it will constantly update:
Some people may be wondering here why we couldn’t just create a group instead. Let’s break that down:
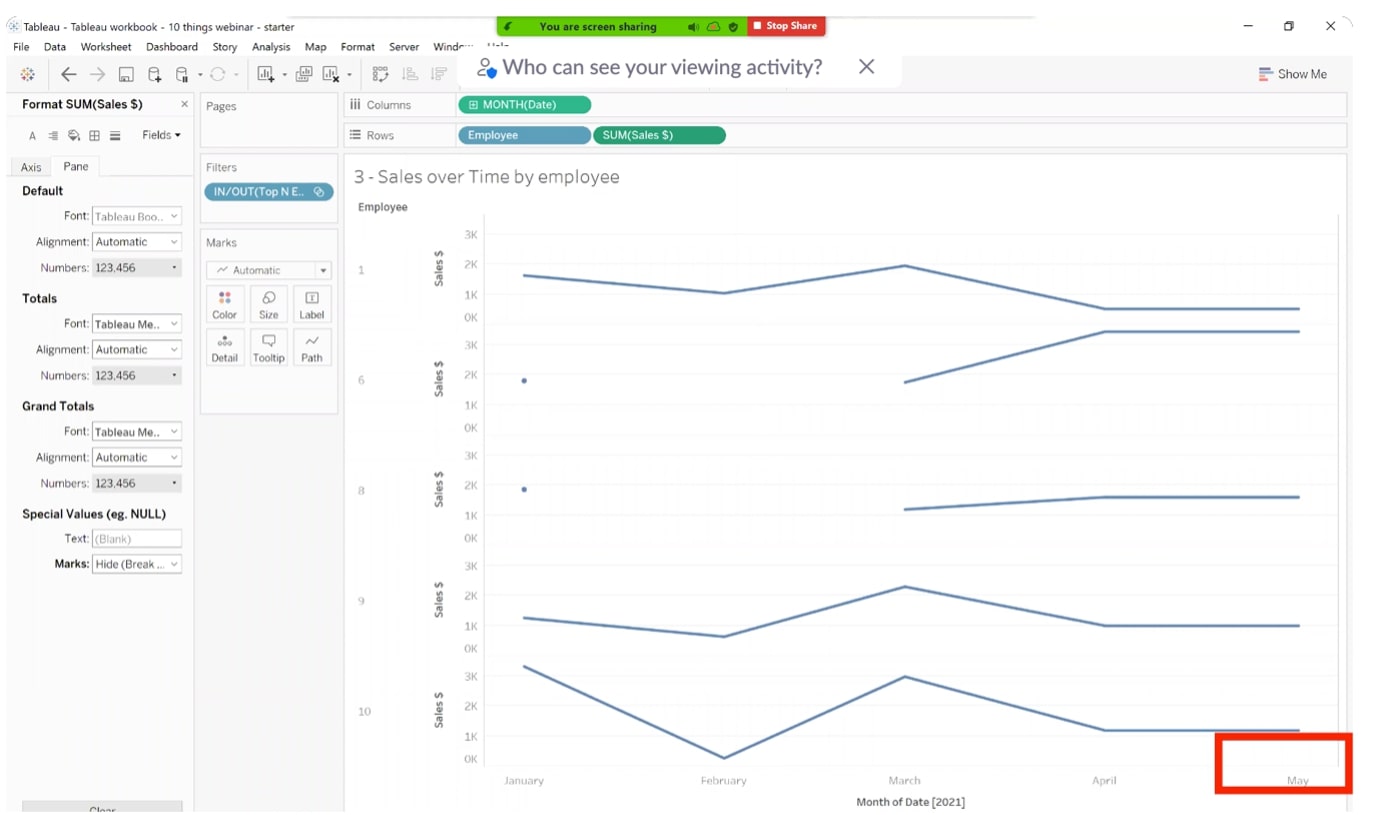
Tip 5 – Special Values: To Null or Not to Null?
Null values can be incredibly frustrating for any analyst, especially if they disrupt a visualisation or affect how your data is interpreted. Special values allow you to manage how nulls are shown (or not shown). Here, you can choose how those null values are displayed or hidden depending on the impact they have on your data. It’s important to know how to manage these null values, so we know how to validate that data as we create our worksheets:
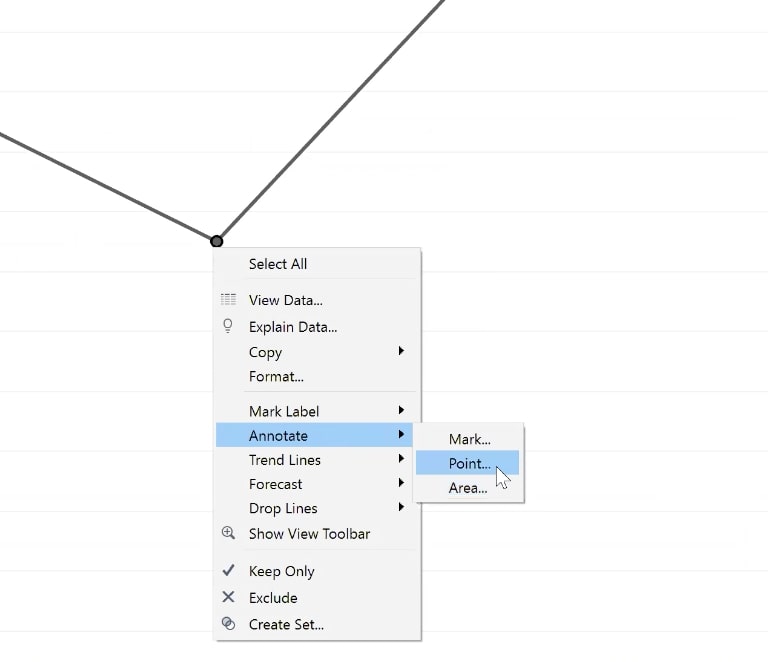
Tip 6 – Adding Context with Annotations
Sometimes, the data we present in our visualisation doesn’t always give a clear picture to the end consumer, and the story needs some additional context. Annotations are great at adding key information to a visualisation. You can choose between any Area, Point or Mark to make your annotation and have limits on dynamic charts:
Tips 7 and 8 – Dynamic Parameters & LODs: Fab Friends
These are two very important topics we InterWorkers like to discuss all the time. Both of these are fun on their own, but when combined, they become even better! Dynamic parameters fill with data from your dataset automatically. LOD (level of detail) calculations let you set aggregations to get the precise thing you’re after. Putting them together defaults a dashboard to the most recent date.
Tip 9 – Dashboard Containers as Organisational Hacks
Let’s put our sheets into a specific and condensed form, so the end user will have a layout with which they are familiar and thus comfortable:
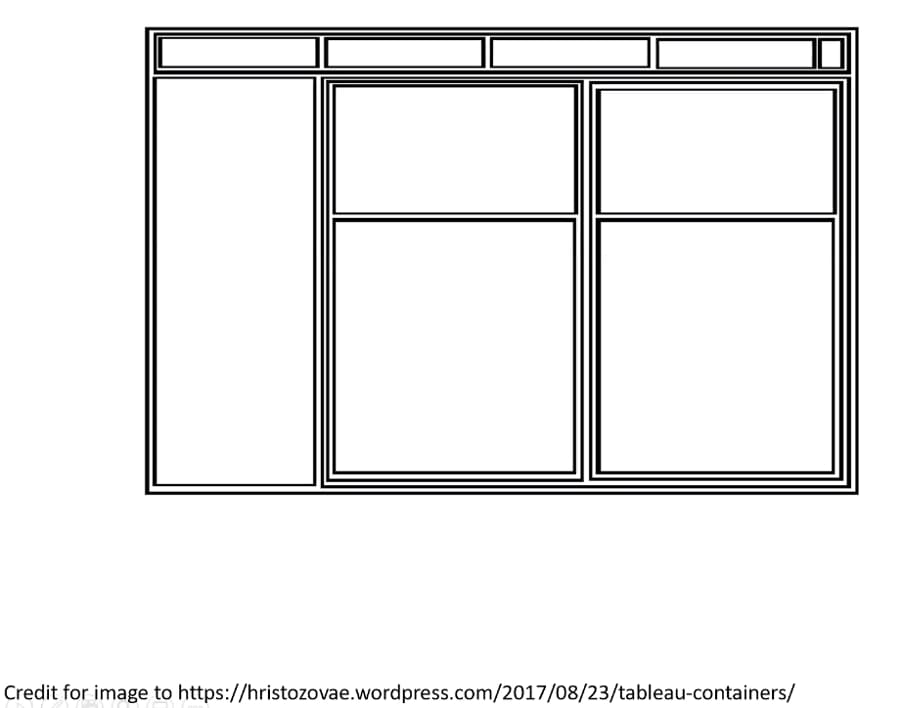
Why are containers valuable?
- They help organise your dashboard, e.g. keeping sizing consistent
- Useful for formatting, e.g. background colours
- Add show/hide options for uncommon filters/directions
- Use like a blank item not yet complete
Tip 10 – User Filters with Only Their Data
Another great tip is to make sure the end consumer of your report is only seeing what is relevant to them by filtering the data for them. This is a nice way to support consumers as they digest information that is most relevant to them without bamboozling them with less relevant data. Filters can also be used for the opposite use case where data is hidden from users that aren’t privy to that information.
Watch the Webinar
If you’d prefer to follow along with the webinar presentation, feel free to explore the recordings below. Find the webinar that corresponds to your region for the most relevant experience, or mix it up if you prefer! As always, reach out if there are other ways we can help.
Webinar Replay – US
Webinar Replay – APAC
Webinar Replay – EMEA