Tableau Deep Dives are a loose collection of mini-series designed to give you an in-depth look into various features of Tableau Software.
In part one of this two-parter, I went into a lot of depth on how to use custom sorts within table calculations. I highly recommend reading that article first before continuing with the second part. In this post, we’re going to apply those ideas to illustrate how useful they can be with a little imagination.
Ascending Running Sum
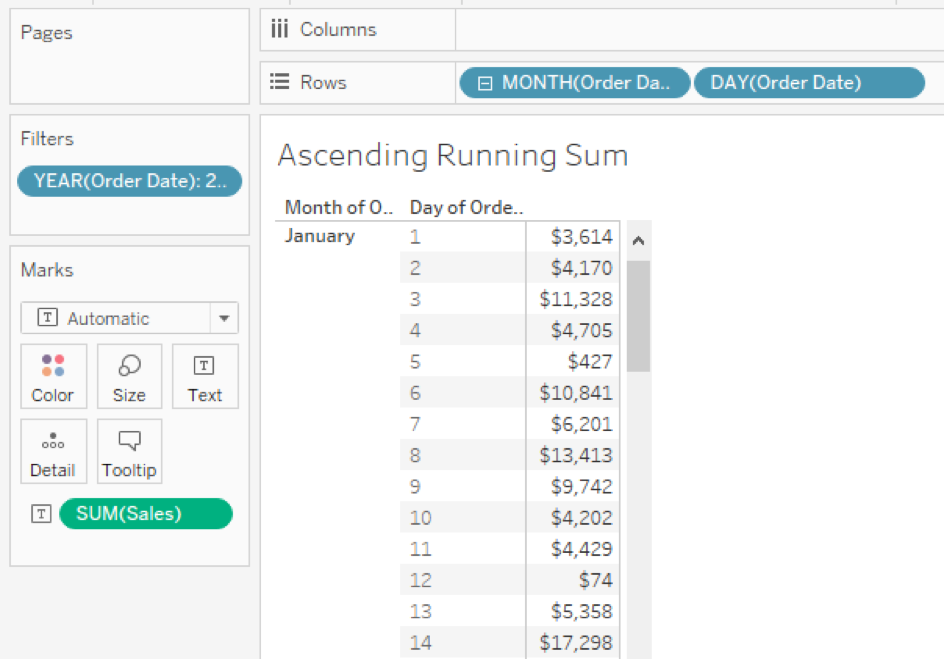
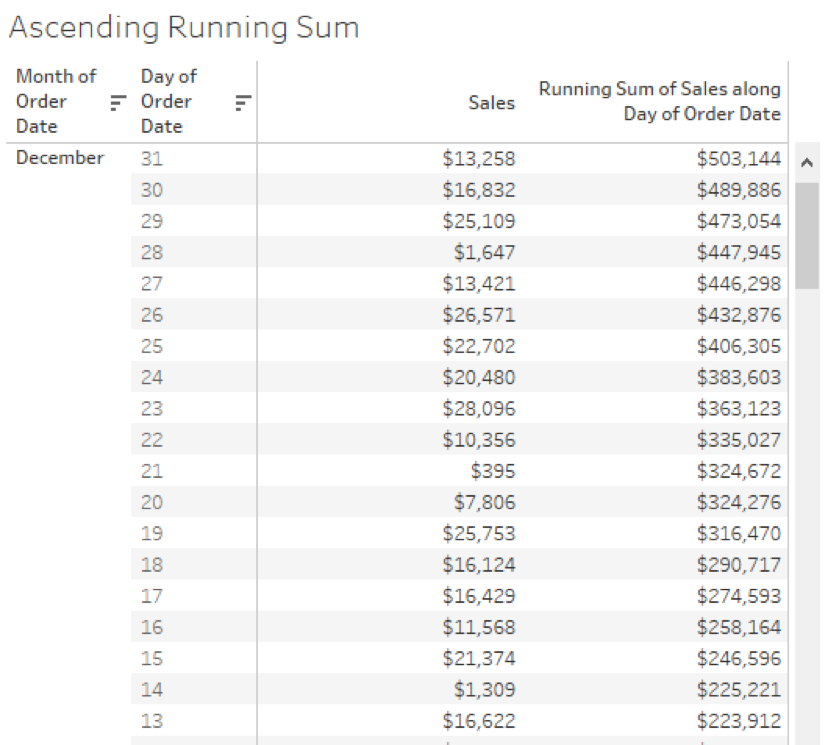
Let’s begin with some basic concepts and then apply some extras as we go along to make it into something fun. I’ll start with an ascending running sum. Rather than Pane (down), we are effectively creating a table calculation that is running Pane (up). Why would we need to do this? In our use case, we’re going to show sales as a month-to-date total with the most current day at the top of the table. Here’s the basic table showing Month and Day along with SUM of Sales below:
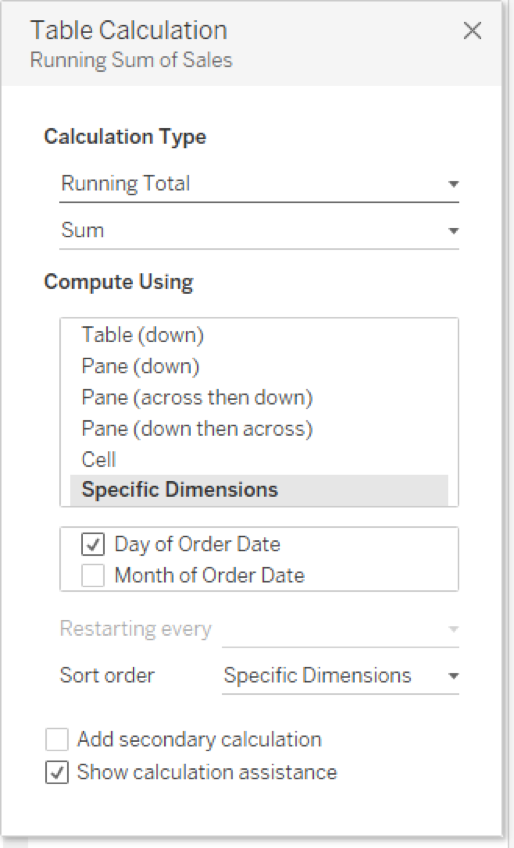
Now, let’s add a second SUM of Sales with a Running Total (SUM) table calculation onto this view, restarting on each month:
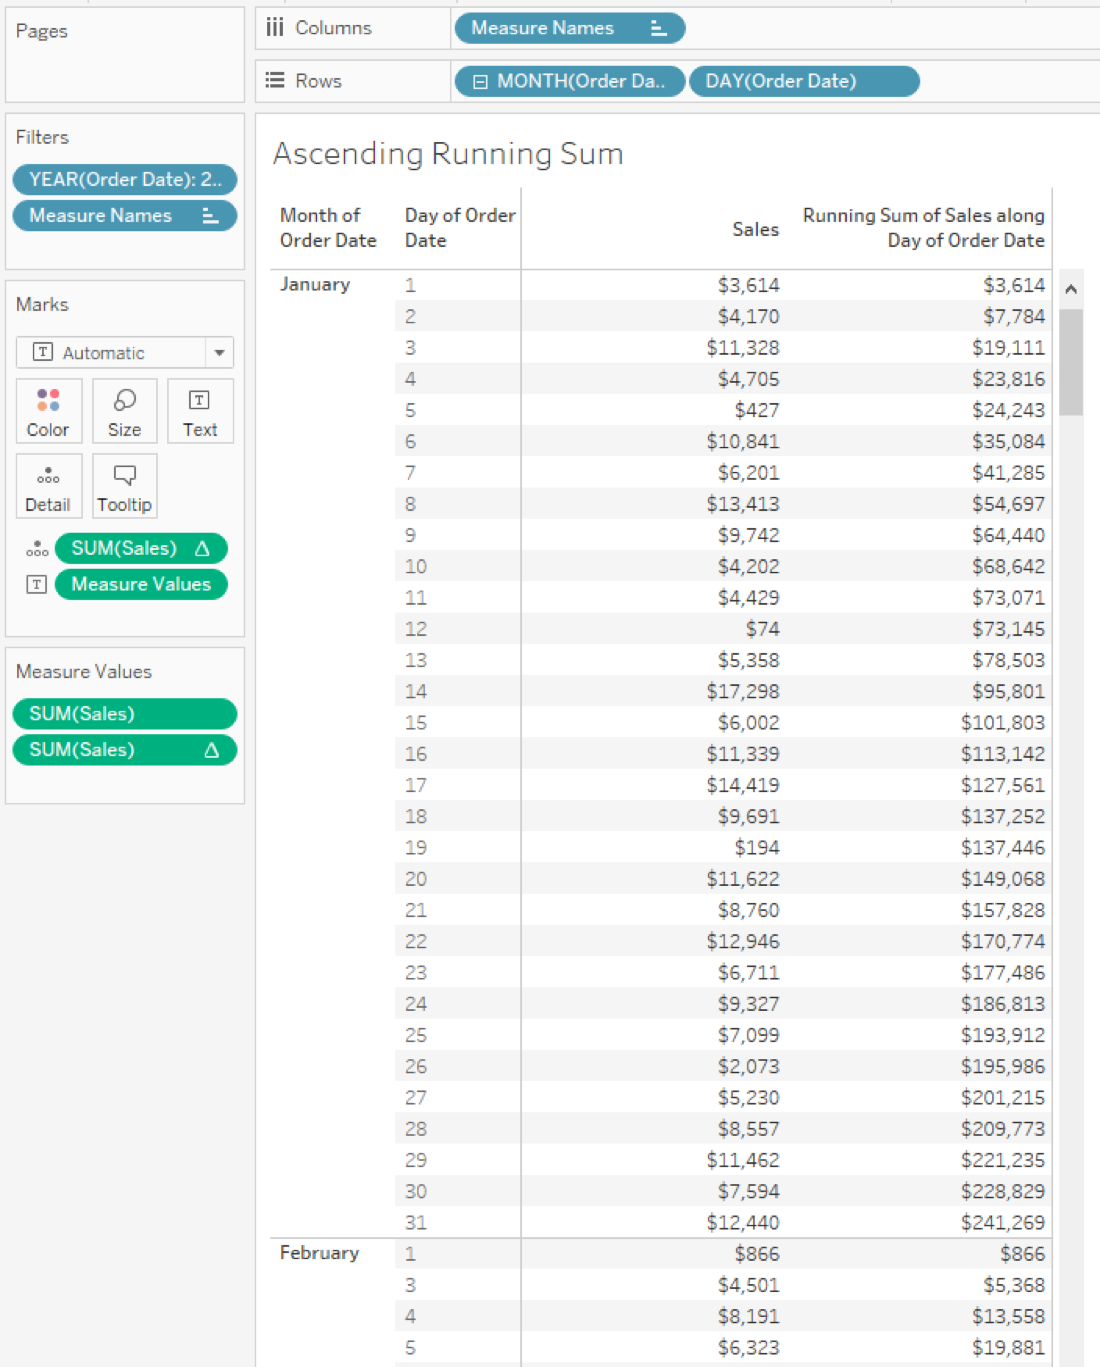
You should get this view:
I’m going to re-sort my Month and Day date parts on Rows in ascending order to get the most current date at the top of each month pane. My table calculation does not change, still effectively going Pane (down):
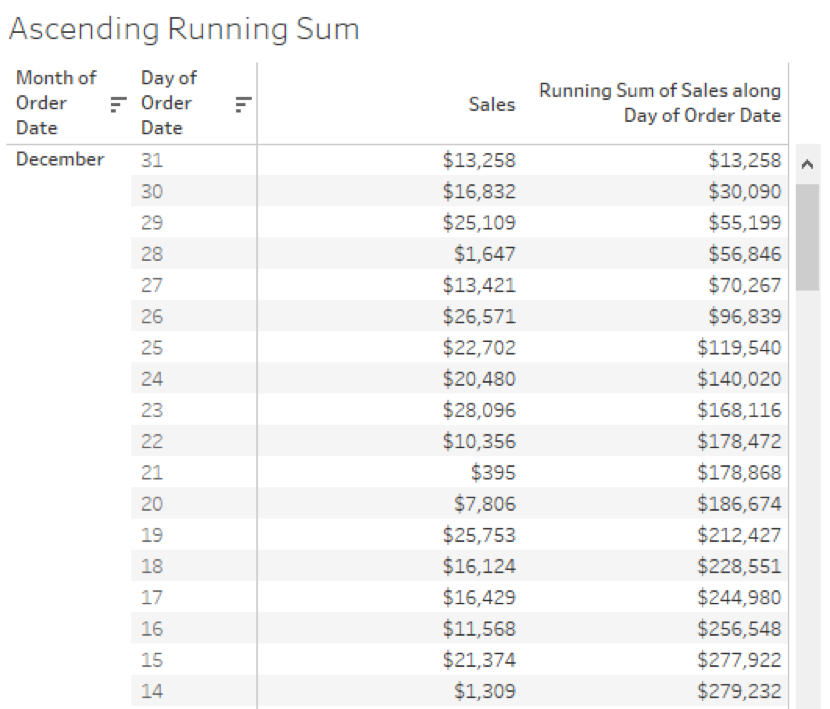
Let’s do a custom sort on our table calculation to change the order that the Running Sum computes across our data. I want it to sort in reverse order:
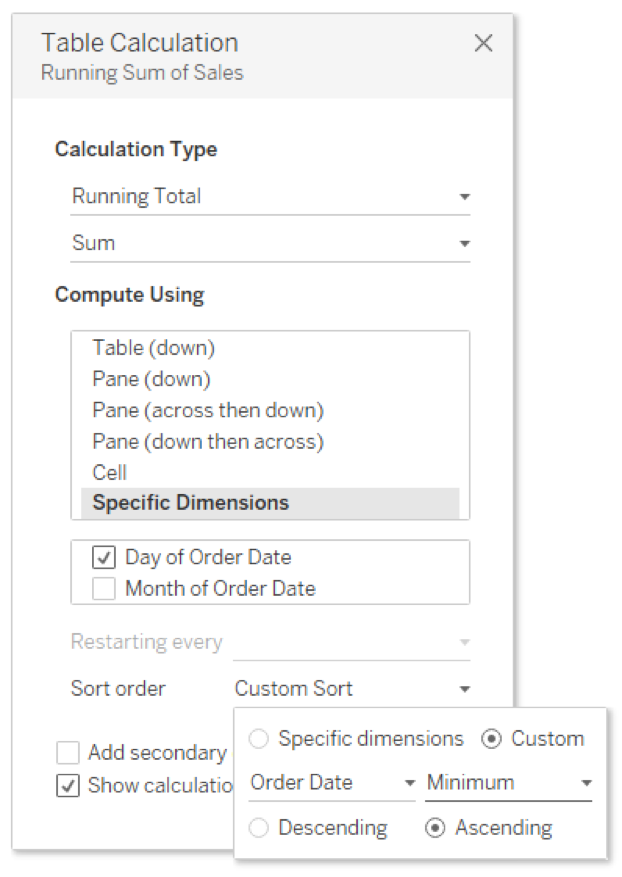
Remember, the minimum is to satisfy the aggregation requirement for the sorting dimension. Minimum or maximum would have worked fine in this instance. This will give our table the current daily sales next to the MTD total, like so:
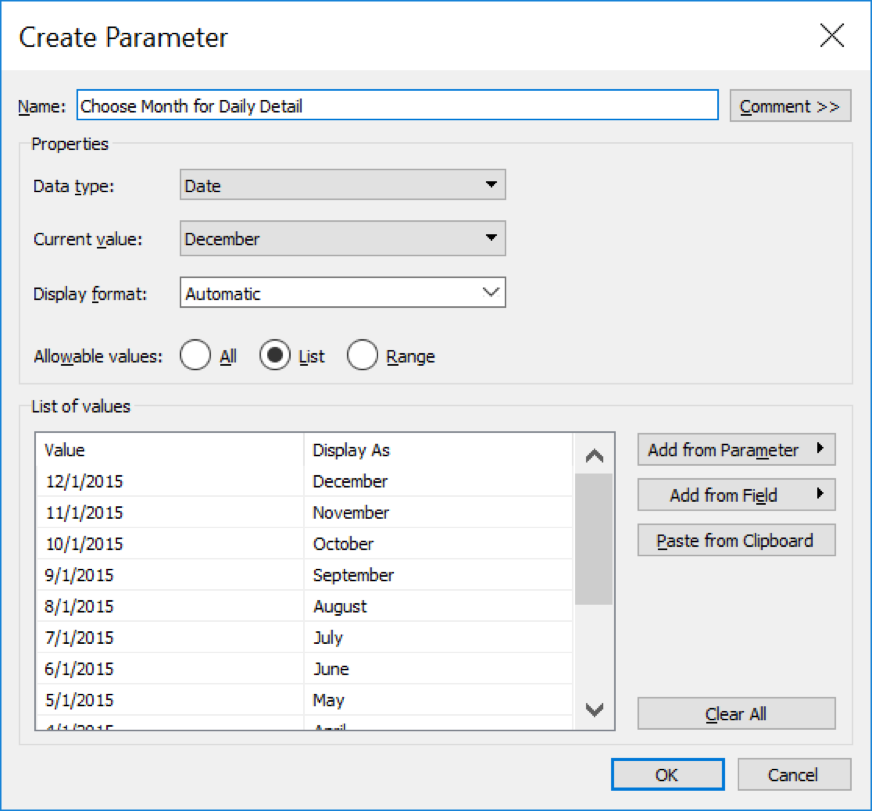
I’m not interested in seeing the daily detail on every month. It makes the most sense to see the daily detail on the current month, but I want that month aggregated into a single monthly value. It’s best to start with our parameter to determine our level of detail by month:
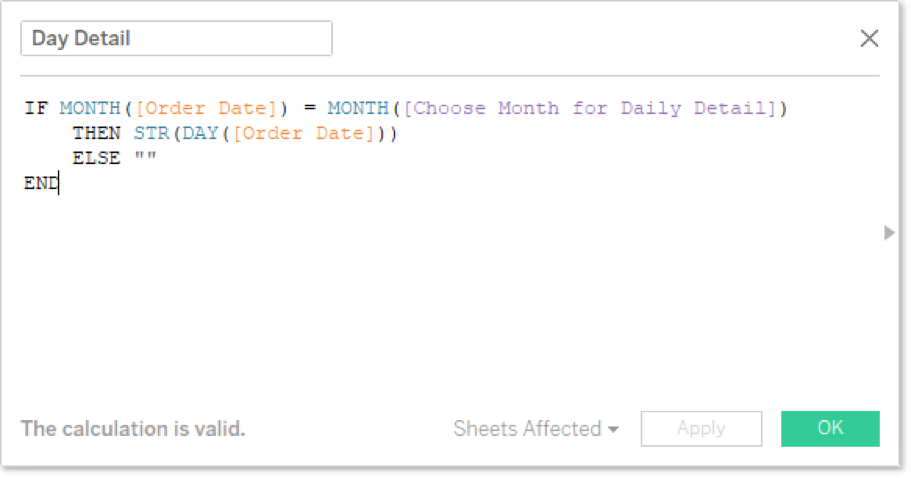
Let’s use our parameter in a calculated field to control the level of detail for that month:
As well as a calculated field for Daily Sales:
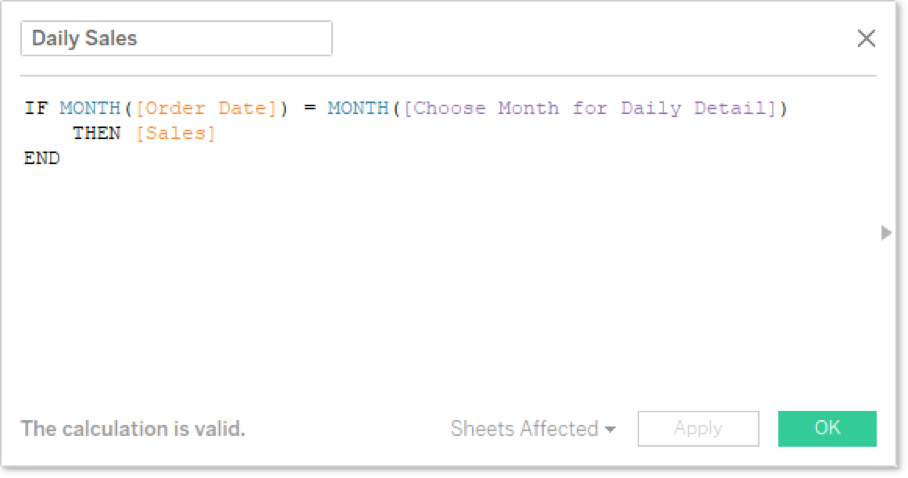
The Day Detail field will replace the day date part on Rows. And to put a little polish on our view, let’s drag the Sales table calculation onto our Data pane and give it a friendly name for our users. This is our final view:
What’s Next?
Be sure to check back on the InterWorks blog for more content on Tableau and table calculations. Leave any questions or thoughts in the comments section below. Cheers!

