The Tableau Performance Checklist series is designed to help you streamline your dashboard performance and Tableau Server configuration. Each post expands upon one item listed in the master Tableau Performance Checklist. As of 2024, you can find an updated Tableau Dashboard Performance Checklist here.
The next guideline in our list of Filtering tips is:
“Keep range quick filters simple. The more complex the range, the slower the query.”
Sound exciting? Let’s go!
Quick Filter Overview
Quick filters are a quick and easy way to add interactivity to your visualization or your dashboard, either with local filters or global filters. You have a lot of different options in how your quick filters operate. The options that you’ll be able to choose from will be contextual based on the data type of your field.
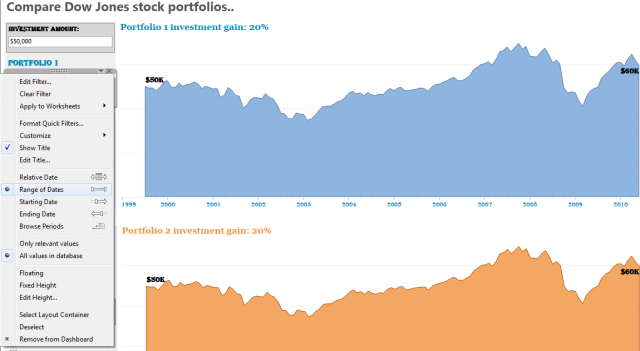
The range quick filter is available with numeric and date fields. Here’s what it looks like:

You can set both ends of the date timeline to be adjustable as well as just the start or the end date.
Performance Problems
Problems arise with this type of quick filter when there are too many unique values in the filter options. We addressed this topic in part in a previous Performance Checklist article on high-cardinality in quick filters. For example, having a date range on your quick filter over a five-year period sounds reasonable enough but not if you can filter down to the day level. If you don’t prepare your filter or associated field, then that’s exactly what you’d be doing.
Not only does this slow down your visualization, but it also offers a level of detail on your filter that isn’t particularly useful for your report consumer.
Simple Is Always Best
The rule of thumb here is to keep any quick filters that uses a range as simple as possible. Rather than using any date dimension in your data source, such as Date of Sale or Shipping Date as your filter, consider just using the year or year and month as your filter values.
If your report consumer needs to see data down to a specific day, then that’s probably best handled in a separate visualization and not with a range quick filter.
Mastering Best Practices
If you’re interested in becoming a Tableau Server guru, then learning these performance best practices is essential. Check back frequently as we add new posts and dive deeper into each point in the Tableau Performance Checklist.
Another great way to identify best practices is to leverage the insights offered by our Performance Analyzer, part of Workbook Tools for Tableau. It will examine all of your workbooks, worksheets, dashboards and data sources against a list of best practices to ensure that you’re using all the tips and tricks to guarantee your visualizations are moving at light speed.
As always, feel free to get in touch with us if you have any questions regarding performance or anything Tableau related! We’d be happy to help.

