Tableau Deep Dives are a loose collection of mini-series designed to give you an in-depth look into various features of Tableau Software.
In last article in our Deep Dive on Sets, we will explore how we can use sets inside of a hierarchy. It adds dynamism to your hierarchies, particularly if you nest multiple computed sets into a single hierarchy. Let’s learn how to do it!
Hierarchy Overview
A hierarchy allows us organize different dimensions into a structure that can be expanded or collapsed inside of our view. It is very common to create hierarchies from geo-fields, such as:

When a hierarchy like the one above is applied to a visualization, it can be expanded for additional detail. This can be accomplished by click on the + or – next to each field, either in the Rows or Columns shelf, or on the column headers in the view.
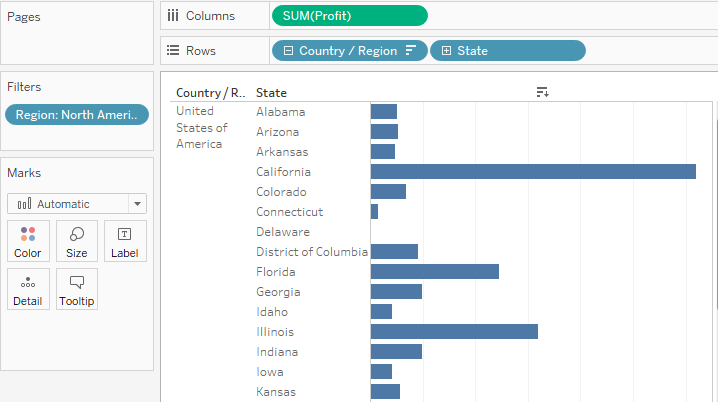
Adding a set can greatly increase the functionality and use cases for a hierarchy. Let’s examine two different possibilities.
Use Case #1
Let’s take our example from above and add a set that evaluates whether a state is a mature market (200 or more customers) or a target market (less than 200 customers). To start, I’ll right click on State and select Create > Set. Here’s how we’ll construct our set using the Condition tab:
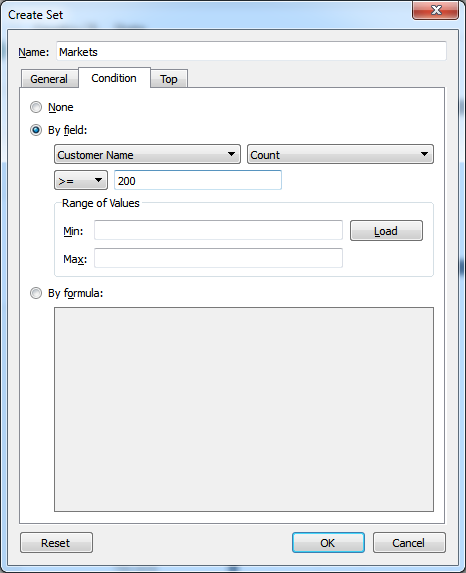
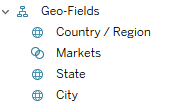
Our states that are mature markets will be IN our set, while those with few customers will be the OUT of the set. Now let’s insert our Markets set into our Geo-Field hierarchy. We can do this just like any other field, by dragging it to the hierarchy and positioning the black bar in the order in which we want it:
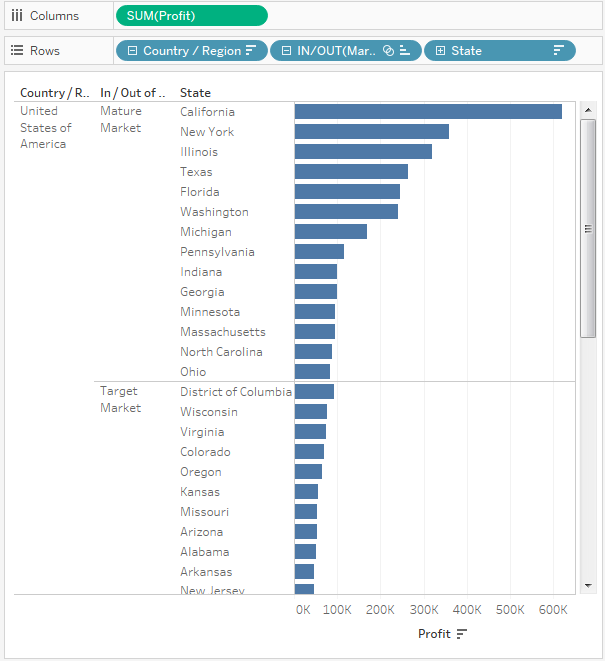
Remember, our Markets set is based on a logical condition. It will update the IN membership as the data changes. Here’s how the set looks when added to the view. I’ve changed the IN and OUT aliases to match our logic (i.e. Mature Market for IN and Target Market for OUT).
Use Case #2: Nested Sets
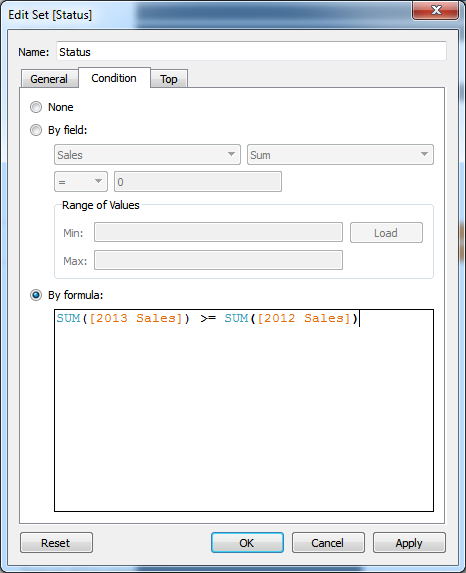
Now we will add another set to nest into our Geo-Field hierarchy. In addition to understanding our mature markets (200+ customers) and target markets (>200), I also want to designate which markets have improved on the previous years’ sales. I’ll designate these are Growing (IN) as opposed to Declining (OUT). I’ll call my set Status and create a logical condition based on the last two years of my data source’s data (2012 and 2013):
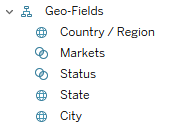
I’ll now slot my Status set into my Geo-Field hierarchy between Markets and State:
Now let’s add our updated hierarchy to our view showing the sum of sales. I’ve changed the IN and OUT aliases for my Status set to instead read Growing or Declining.
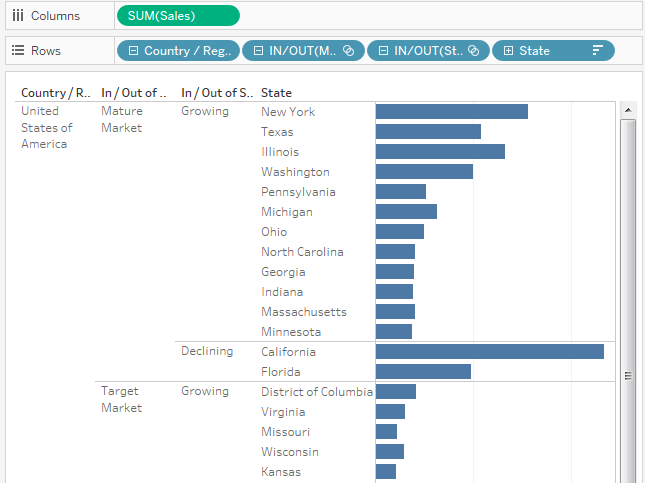
Remember, both of my sets (Markets and Status) are computed. So, if the data changes, so will the structure of this table.
What’s Next?
This is the end of our Deep Dive on Sets. Be sure to check back on the InterWorks blog for more content on how to use Tableau Desktop and Server from our team of consultants. Also, I’d love to hear your questions or thoughts in the comments section below.
And here’s to always having great sets! Cheers!

