Tableau Deep Dives are a loose collection of mini-series designed to give you an in-depth look into various features of Tableau Software.
At the start of this Deep Dive series, I stated that there were four standard use cases for parameters: filters, bins, reference lines and calculated fields. What about other areas, such as table calculations? Why can’t we use parameters there?
The answer is: You can!
You just have to do a little extra work. Let’s start by looking a standard table calculation and then how we would add a parameter to it.
Table Calculations in Tableau
To add a table calculation, I right-click on any measure used in my view and select Add Table Calculation or Quick Table Calculation. I’m going to start with the initial view of Profit displayed over continuous months:
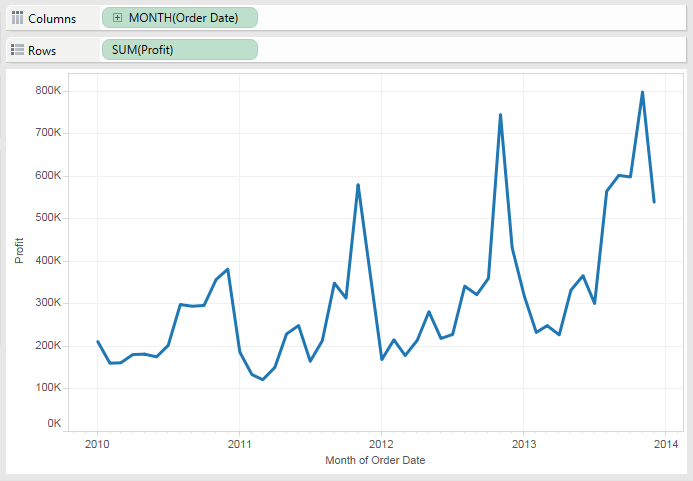
I want to add a table calculation to my Profit measure for a moving average:
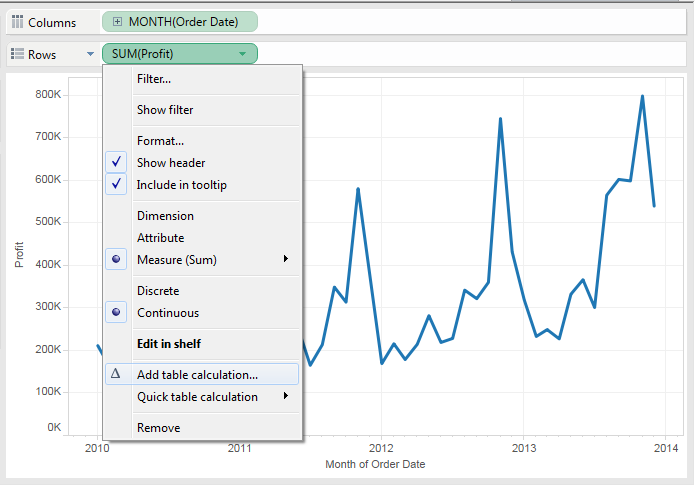
Here’s the Table Calculation window that pops up:
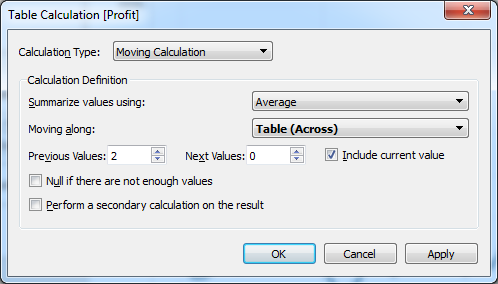
Perhaps I want to add a parameter for my Previous Values. I want to be able to give my user the option of changing how many previous values are used to calculate the moving average. This allows the user to decide how little or how much emphasis is placed on recent values. The more values we include, the smoother our moving average is going to look.
Unfortunately, Tableau doesn’t offer me the option to include a parameter inside of my Table Calculation window. There’s nothing in this window that allows me to select a parameter. At first glance, I may just assume that a parameter can’t be used with this use case.
But wait … we can …
Turning a Table Calculation into a Calculated Field
We can take any table calculation that we’re using in our view and drag it to the data pane to save it as a calculated field. That’s the secret of using a parameter inside of a table calculation. Let’s drag the same moving average table calculation to the Data pane and see how it looks inside of the calculated field editor:
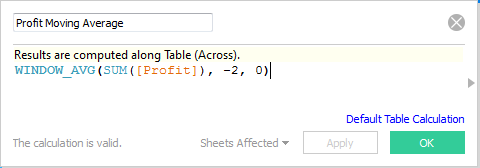
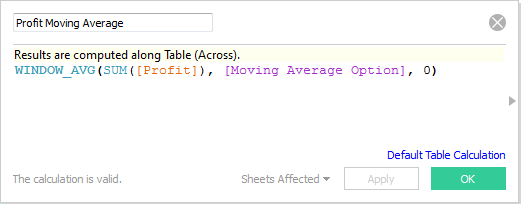
Window_Avg is the function that is performing our moving average within our table calculation. In this form as a calculated field, we can add our parameter. Let’s change the Previous Values to a parameter to allow the user to include the last two months, six months and 12 months.
Let’s build the parameter. In constructing our list of values, remember that we need to use negative numbers to represent previous values. In the Window_Avg function, the previous two values is represented as a -2, so we’ll frame our list of values as -2, -6 and -12.
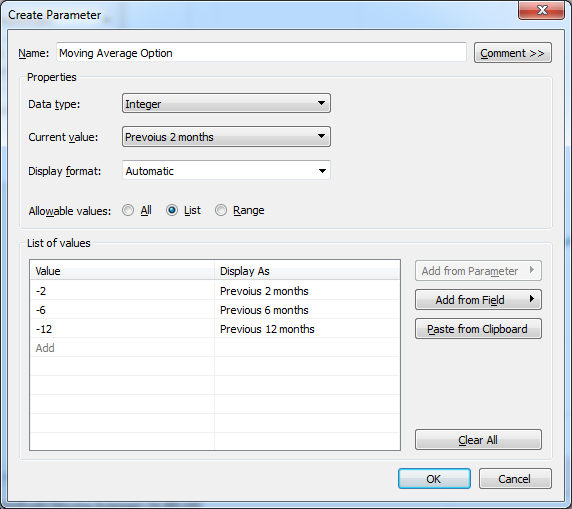
Now, let’s use our parameter in our calculation:
Finally, we need to show our parameter control. Our view now has a parameterized table calculation as such:
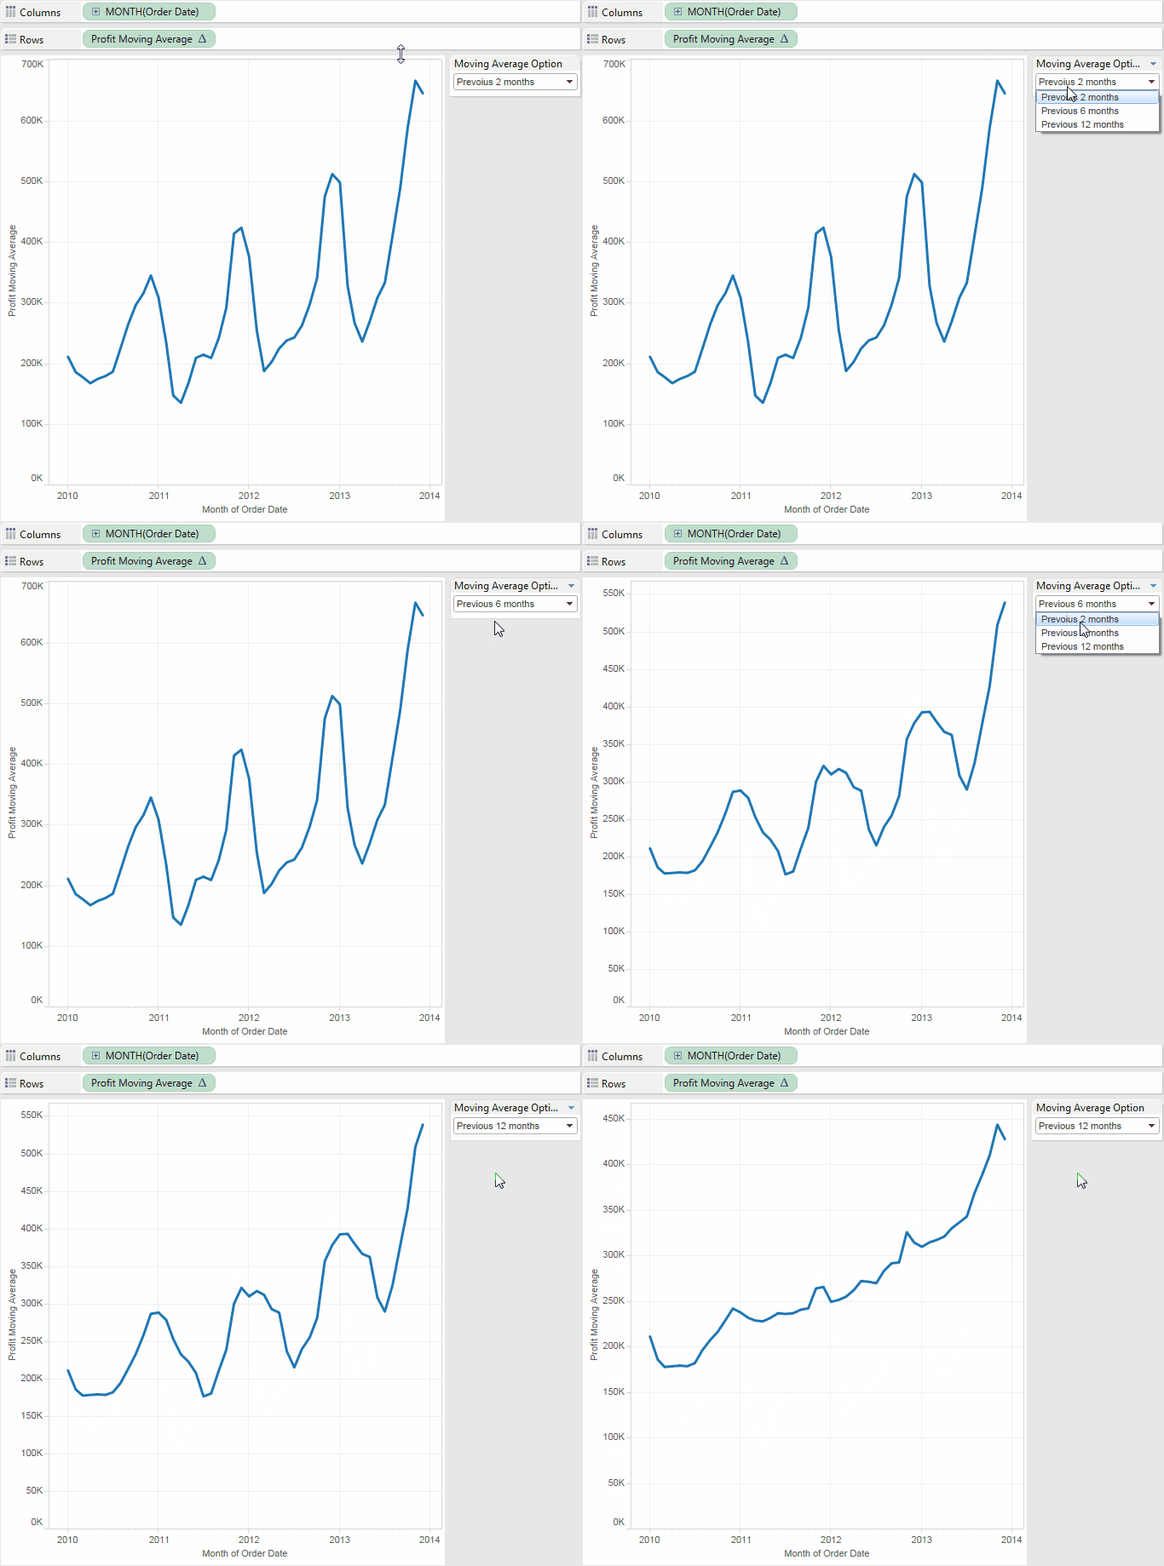
Boom goes the dynamite. Just for fun, let’s go back to our Table Calculation window to see how Tableau has adjusted the settings given that we just added a parameter:
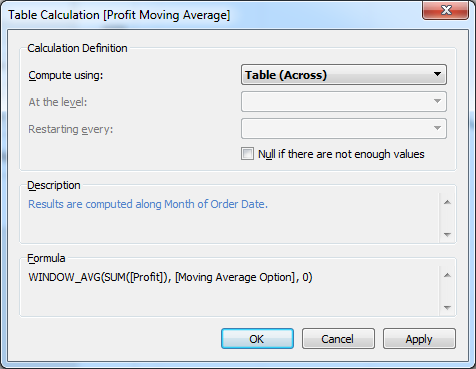
The window options have been changed to reflect the changes that we made in the Calculated Field editor. The summary of our new calculation is listed under the Formula area.
What’s Next?
Obviously, there are a lot of different table calculations that you can use with parameters. That concludes our deep dive on parameters in Tableau. Don’t be sad, we’ll be back very soon with another series of articles. Have a request? Questions? Thoughts? Leave all of it in the comments section below.

