Tableau Deep Dives are a loose collection of mini-series designed to give you an in-depth look into various features of Tableau Software.
In the next article of our Deep Dive on parameters, we’ll explore how we can use parameters to allow our report users to choose the size of their bins within a histogram.
Histogram Review
We talked about the histogram in our Tableau Essentials series here. It’s a visual representation of data, grouped by bins. Let’s build an example using the Sample – Superstore.xlsx data source.
I want to know how long it takes for my products to ship. An average gives me a high level of detail, but it isn’t really that useful. I want to the breakdown of how many products take 1 day, 2 days and so forth to ship. Using the DateDiff function, I’ve created a calculated field called Days to Ship.
DATEDIFF(‘day’, [Order Date], [Ship Date])
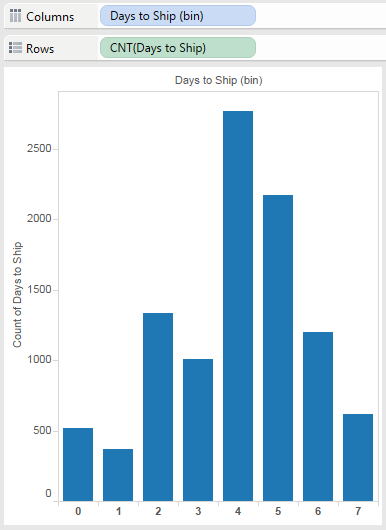
Here’s the histogram I’m going to create:

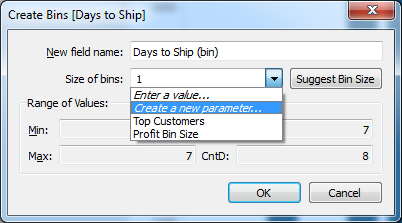
There are two important things here when it comes to building a histogram. First, for your measure, you want to take the Count of it rather than Sum. That’s because we want to know how many instances fall into our bins. Second, the bins themselves: To create a bin, we right-click on the measure and select Create > Bin. That bin will serve as our dimension for our view. Here’s the Create Bin window:
![Create Bins [Days to Ship]](/wp-content/uploads/sites/default/files/blog-content/TDDParametersBins2.png)
I’ve set the size of my bin for 1, as in 1 day; but if I use the drop-down menu, then I see the option for me to insert a parameter:

Parameterized Bins
Creating a parameter for a bin is the same as it is for any other type of parameter. Remember our four steps:
- Create Parameter
- Use Parameter in a Calculation
- Show Parameter Control
- Use Calculation in our View
We’re going to create the parameter now for step #1. As the parameter is being used for a bin inside of our histogram that covers #2 and #4. The last thing we’ll have to do is show the parameter control so our report viewer can use it.
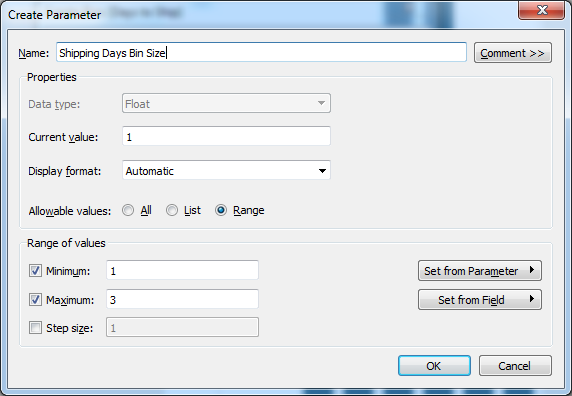
For a bin parameter, I recommend sticking with the Range for Allowable values. Our particular use case for days to ship only has values up to 7, so I’ll make our parameter settings as such:

Our minimum value is 1 day per bin. Our maximum value is grouping products that took multiples of 3 to ship. For instance, all products that took 0, 1 or 2 days to ship would go into our first bin at the maximum size. All products that took 3, 4 or 5 days to ship would go into the next one and so forth. Tableau will automatically select Float as your data type on initial creation. To change it to Integer, which makes sense for our histogram, go back and edit your parameter. You can then select Integer from the Data Type drop-down option.
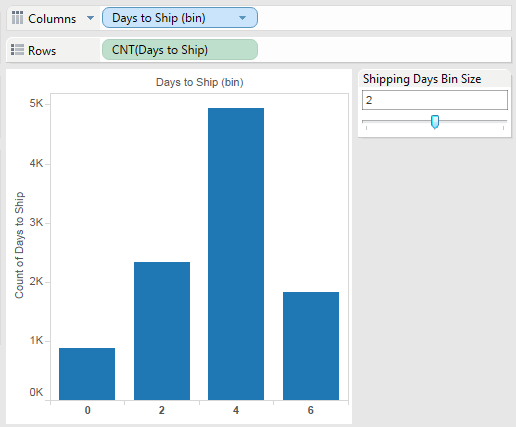
Time to show our parameter control. Remember, right-click on the desired parameter in the Parameters section of the Data pane and select Show Parameter Control:

As you can see, I’ve selected a slider for the parameter control as it makes the most sense for what we are showing. You can edit your parameter control just like a filter with a lot of the same options in terms of how they display and function for the report user.
What’s Next?
In our next topic on the Parameter Deep Dive, we’ll look at reference lines. As always, I’d love to hear from you. Be sure to add your thoughts, suggestions, questions or additional ideas in the comments section below. Happy histogramming!

