
Averages can be weighted too heavily on historical data: models expire, conditions change and behavior evolves. That is why a data analyst keeps a lot of tools in the kit to create an accurate picture of the present day. Window functions are used to remove the noise from random variation and remove the weight of irrelevant historical data.
If you are like me, when it is time to prepare a data set for analysis, you turn to Alteryx. But you may have noticed that Alteryx isn’t great with window functions. You can simulate window functions in Alteryx using the Multi-Row Formula Tool. However, dealing with large or variable windows can be difficult. Fortunately, the R Tool ensures that Alteryx can do anything that R can do.
In the first part of this two-part series, we will use the popular R packages data.table and caTools to calculate a moving z-score along a five-month trailing window. Window functions allow us to apply aggregate functions (e.g. sum, average, etc.) over a moving set of rows instead of over the entire column to which the aggregate function is applied. While this piece explores specifically how to perform a moving z-score, the pattern can be adapted for other purposes. In the second part of this series, we will learn how to turn this module into an app that will work on any time series. Feel free to follow along with the attached ZIP file found at the end of this post.
Preparing the Data
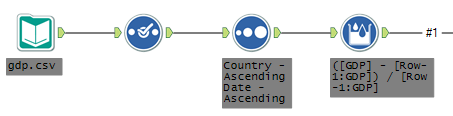
Using a CSV that contains GDP time series for several countries, sort by Country and Date and then use a Multi-Row Tool to calculate Change: the percentage change in GDP by country over each date. The point of this exercise is to identify any unusual changes in GDP, so Change will be our target variable to calculate mean, standard deviation and eventually the z-score. Remember to select Country in the Group By section and use the following formula:
([GDP] – [Row-1:GDP]) / [Row-1:GDP]
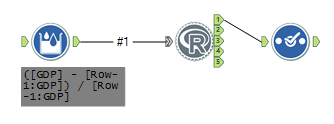
Using R to Calculate Moving Mean and Standard Deviation
We will now need to utilize the R Tool to get the window function that we require. In order for this to work, we will need to necessary packages installed in our Alteryx R library. If you have predictive tools installed with Alteryx, this should be located in <Alteryx Directory>R-3.1.2library. Your Alteryx directory will most likely be C:Program FilesAlteryx but could be different depending upon your installation options. Additionally, depending on your version, you may have an earlier or later version of R installed with Alteryx so check the directory name. It should look like R-*.*.*.
For more information on installing R packages visit: http://www.r-bloggers.com/installing-r-packages
Once you have the correct packages installed, simply insert the code below into the R Tool properties:
##Read the Alteryx input as a data.table
DT <- as.data.table(read.Alteryx("#1", mode="data.frame"))

## Display the cols Date, GDP, and Change then perform runmean and runsd by Country
## Window size of 5
write.Alteryx(
   DT[,.(Date, GDP, Change, Mean=runmean(Change,5,endrule="mean",align="right"),
   SD=runsd(Change,5,endrule="sd",align="right")),
   by="Country"],
   1
)
The goal here is to calculate a running mean and running standard deviation with a window of five trailing months. Once obtained, we will use those to calculate a z-score. The function read.Alteryx() is specific to Alteryx and reads an incoming data stream as the selected mode. Here, I am using the as.data.table() function to convert the data frame to a data table. The package data.table is a popular package that removes many of the idiosyncrasies involves with R data frames. A full discussion on data.table is outside of our scope but keep in mind that my way above is only one way to achieve window functionality in R.
With runmean() and runsd() from caTools, I have calculated a running mean and standard deviation portioned by Country for our entire data set. This is why it was necessary to sort the data before input into the R Tool. Field types can be wonky when the data stream exits the R Tool so be sure to place a select afterword to adjust accordingly.
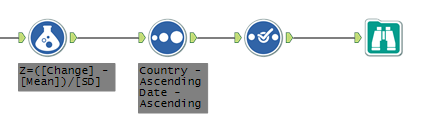
Z-score
The hard work is now over! With change, mean and SD calculated, all we need is a Formula Tool to compute the z-score. Use the following formula:
([Change] - [Mean])/[SD]
Sort again to ensure output is in a sensible format and attach a Browse Tool to see your results:
There you have it! For more information about the window R packages we are using, please visit the caTools reference manual. I also encourage any R users to find out more about of data.table.
Find Us at Alteryx Inspire 2015 for More
Alteryx Inspire 2015 is coming up, and we'll be attending! We would love to meet you at the InterWorks kiosk. Stay tuned for the second part of this blog, and be sure to find us at Inspire to learn how to do more magic with Alteryx. Head to our official Alteryx Inspire event page to learn more.