This blog series walks through the versatility of filters in Portals for Tableau. It examines numerous filtering options to demonstrate how to optimize your dashboard to its fullest potential.
Please note that Portals for Tableau are now officially known as Curator by InterWorks. You can learn more at the official Curator website.
One of the biggest selling points for Portals is the power of their filters. They’re web-friendly, fully customizable, dynamic and even sticky from dashboard to dashboard. We get a lot of questions from users who want to pull the filter options from the dashboard dynamically, but then they run into issues with performance. This series will be a deep dive into each step of creating a fully optimized Portal filter setup. The first step on this journey will be figuring out just what Sticky Filters are.
Applying Filters to Multiple Tableau Dashboards
If you have a preferred set of filter values you use on your Tableau reports, it can be a bit tedious to apply them every single time you open each dashboard. Portals looks to solve this with Sticky Filters. If you have Sticky Filters enabled, when you choose a set of filter values for one dashboard, they’ll be applied to the next with no extra brouhaha!
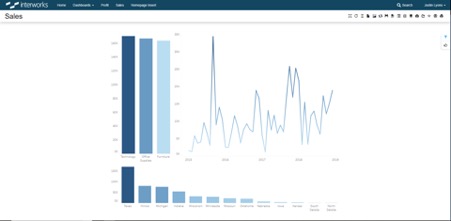
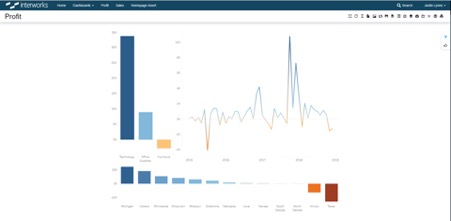
Let’s look at how to set up these Sticky Filters and watch them in action. Here are a couple simple dashboards that are live in my portal:


Let’s create a couple portal filters and make them sticky. You can navigate to your portal backend, then to the Tableau menu:
![]()
You’ll already be in the Filters menu, so go ahead and click that shiny, blue New Filter button:
![]()
Here, you can pick the name of the filter, the Type (Single Select, Date, etc.), as well as other various settings. When filling out the Field Name (In Workbook) field, be sure to make it is exactly as it is in your Tableau workbook; otherwise, it will not fire correctly:

Next, flip on the Is Sticky Filter? setting:
![]()
Nice! Our filter is sticky! It doesn’t have any values yet, though. Scroll down to the bottom of this form to the Options section. Here, you can add the options you’d like to filter by, and be sure to use the exact name from Tableau for the Value (In Workbook) field:
 There are only three options for this filter, and four for the other I built for this example, so this doesn’t take too long to do. If you have a filter with 100 options, though, it could take a while. We’ll go over how to dynamically and efficiently grab filter values from your dashboard later in this series to solve that issue. For now, go ahead and hit the Create button, and let’s assign these filters to our dashboards. Click the Dashboards menu on the left:

Choose your dashboard then navigate to the Misc tab:
![]()
Here, you can check all the applicable Filters and save. Be sure to do this for every dashboard you’d like these Filters to affect:

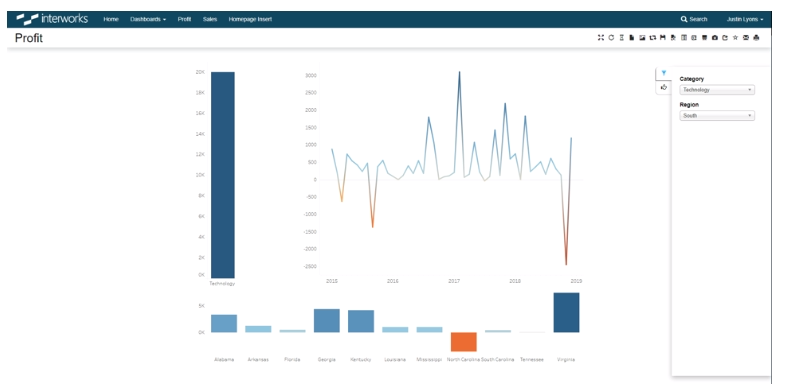
We’re all set up! To demonstrate, I’ll filter the Category dimension to Technology and the Region dimension to South while viewing the Profit dashboard:

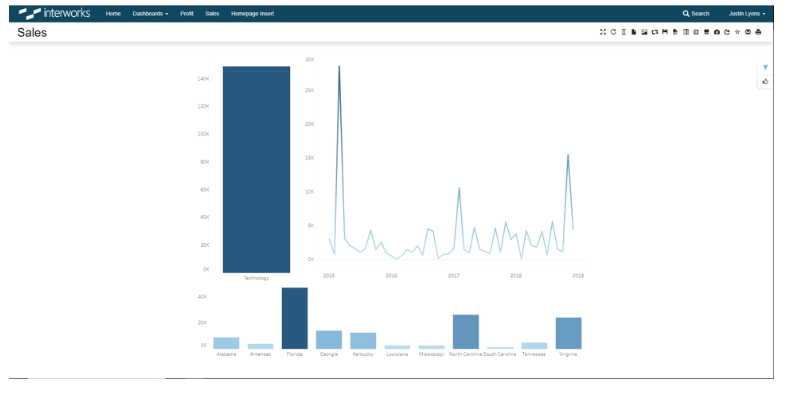
Now, I’ll navigate to the Sales dashboard in the Portal and TADA! The filters are applied:

This is a simple example, but imagine having ten filters on four dashboards that you would otherwise have to configure for each. That’s THIRTY filter values you don’t have to worry about choosing! Now, go utilize this feature, and enjoy a cookie with all the time you saved not applying those filters over and over and over again!

