
This blog series walks through the versatility of filters in Portals for Tableau. It examines numerous filtering options to demonstrate how to optimize your dashboard to its fullest potential.
Please note that Portals for Tableau are now officially known as Curator by InterWorks. You can learn more at the official Curator website.
We’re continuing on with our blog series about how to fully unlock all of the filtering power available in your Portals for Tableau. The last post went over dynamically grabbing filter values from the dashboard itself to avoid having to manually input copious options. This option is incredibly convenient but alone might cause some increased load times. Fortunately, we have a solution that will allow both dynamic filter values and limited increase in load times: grabbing those values from a specific “hidden” sheet!
Unpacking Dynamic Filtering Options
Mark does a great job in his post about dynamic filter updates describing how to configure this feature and notes at the end that one way to optimize is by creating a separate “Filter” worksheet that is a simple crosstab of all the data needed for the filters. We’re going to build out that idea here so you have a blueprint to follow.
We’ll begin in Tableau. Open Tableau Desktop and create a new sheet. Then all you have to do is pull the variables you’ll be filtering on into the view:
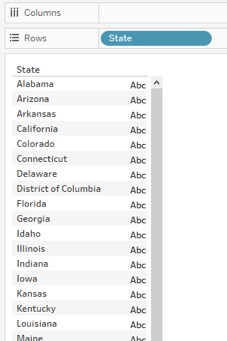
Our use case is building off the dashboard from the previous post and grabbing the 51 (because D.C.) values for State. I’ll add this sheet to every dashboard that will use this filter and make it floating and 1px by 1px to make it “hidden”:
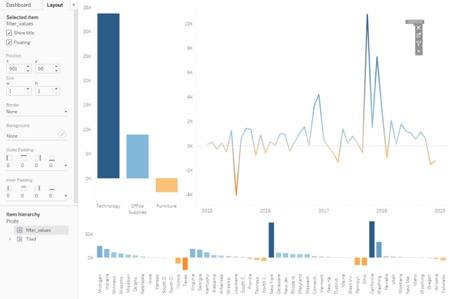
You can see it doesn’t matter where I put it since its small size will make it virtually invisible. Once this is added to all the relevant dashboards, I’ll publish it to my server, which will also be reflected in the portal. Make note of whatever you name the sheet because you’ll need it when we configure it in the portal.
Back in the portal, we already have State set up as a filter. Here’s a quick view of the settings we configured in the last post:
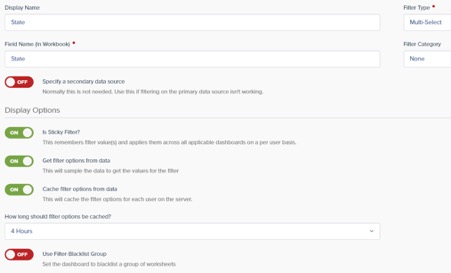
The last piece of the configuration will happen on each applicable dashboard’s settings. You can navigate there by clicking the Dashboards icon in the top-left corner, choosing the particular dashboard and navigating to the Misc tab. There, you’ll flip on Specify Filter Sheet, and type the sheet name into the Filter Worksheet field. Also, using the Use Summary Data option will speed things up by not trying to retrieve all of the underlying data from the data source:

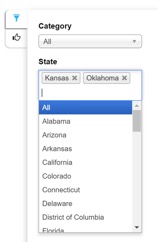
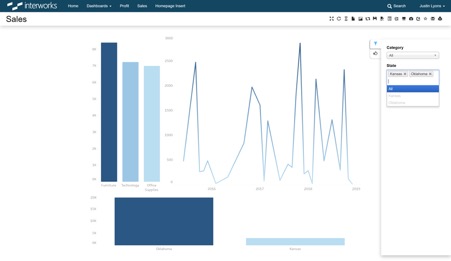
We’re all configured and ready to go:
Increasing Efficiency with Hidden Filter Sheets
Above, you can see the State multiselect is populated automatically! It’s grabbing the summary data from the sheet you specified (the “hidden” one) and building the filter options out of the data. This will be more efficient than simply asking the portal to get the filter values because we are telling it exactly what sheet to get the values from, keeping that sheet’s data small by only having the values on it that we need and only requesting the summary data.
With Sticky Filters enabled, we can check out the options already applied on the other dashboard:
It looks like our filter values automatically applied, but the filter options are reduced to just our sticky filter values. This is because the sticky filters are applied to the dashboard before the filter values are retrieved, so the “hidden” sheet doesn’t have everything we need. Fortunately, we have a solution for this that allows us to efficiently grab lots of filter values and avoid filtering down the sheet we get those values from. We’ll dive into that solution, and the final step in this series, in the next post, so check back!