Tableau Essentials – Title, Caption & Summary
Building a compelling visualization with Tableau is all about telling a “story.” Within your data, there is a story. That may sound strange to new Tableau users or to data analysts in general, but that’s the best way to describe what it means to “guide” your report consumers to the most critical and important insights […]
Understanding R Integration in Tableau
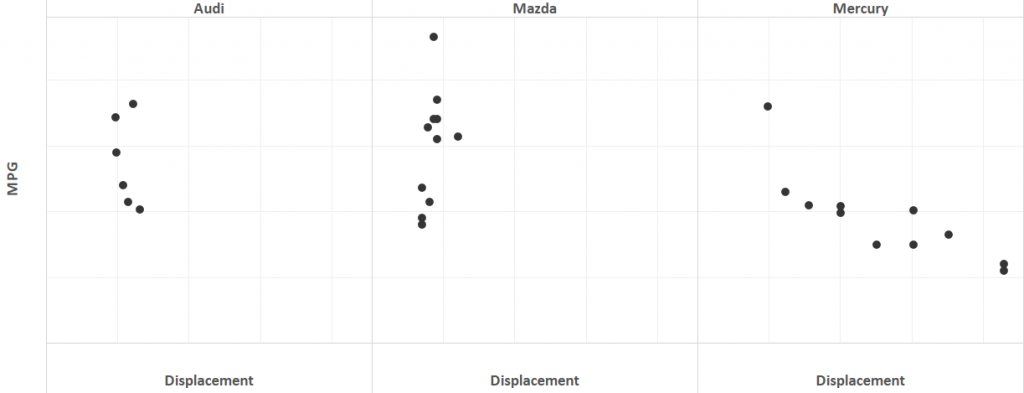
When Tableau released Tableau 8.1, there was a lot of buzz surrounding R integration. Tableau 8.1 has come and gone, and Tableau released another great update with Tableau 8.2. However, I still find a lot of confusion and lack of online resources regarding the actual use of R inside of Tableau. We are spoiled by […]
Use DreamObjects to Backup Your MySQL Database (PHP Script)

DreamObjects is DreamHost’s public cloud storage offering. It’s analogous to Amazon’s S3 offering, but slightly cheaper. The nice thing about DreamObjects is that it is compatible with the S3 API. This basically makes DreamObjects a drop-in replacement – very convenient. DreamObjects is ideal for backup storage. This tutorial breaks down into four parts: Get the […]
Tableau Essentials – Connect to Data
Connecting to a data source will likely be the very first thing you do in Tableau Desktop. Today, we will cover how to do just that, as well as some of the different options available to you. In the future, we’ll revisit this subject to cover more advanced topics, such as joins, blends and custom […]
When to Use Filters, Groups & Sets in Tableau
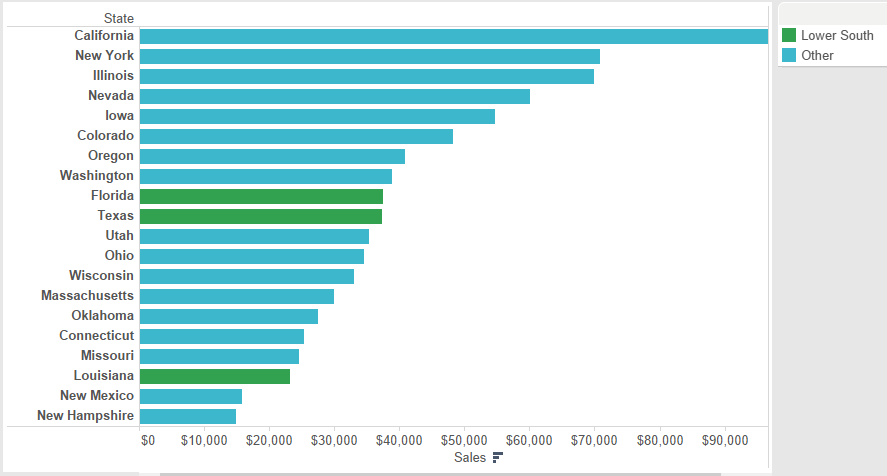
Tableau uses filters, groups and sets to organize data. They were each created for a specific purpose, but differentiating between use cases can be difficult at times. The purpose of this post isn’t a step-by-step guide in creating them; rather, it is a quick guide to “when” or “why” they would be used. First, let’s […]
InterWorks Joins Tableau for the Tableau 8.2 Roadshow
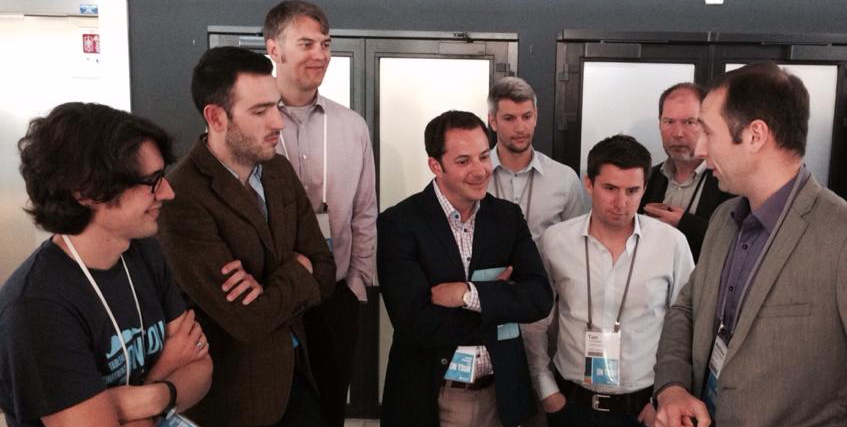
Tableau purchased Power Tools in 2019. Contact Us for more information. InterWorks joins Tableau yet again on their latest major tour, the Tableau 8.2 Roadshow. The purpose of the Tableau 8.2 Roadshow is simple: show off all the amazing new features and capabilities of Tableau 8.2. The InterWorks team covered each new feature in detail: […]
InterWorks Takes the ‘Tableau Your Data!’ Tour to Europe
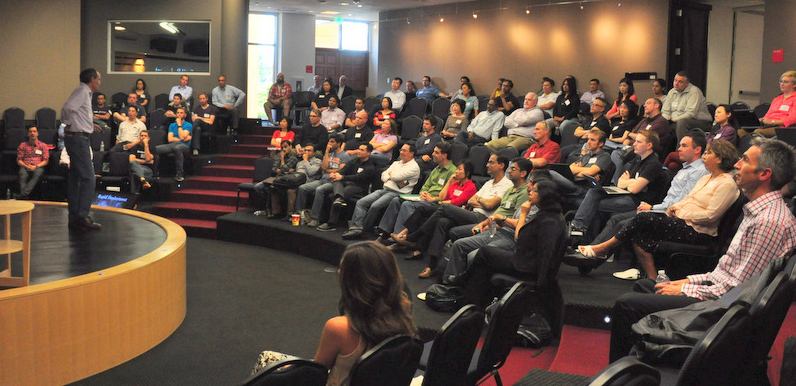
The wait is over for European Tableau fans! InterWorks plans to bring the “Tableau Your Data!” tour to Europe this July. With the U.S. tour winding down and incredible interest from the European Tableau faithful, InterWorks sets their sights on a new continent. Book author and InterWorks’ Director of Business Intelligence Services, Dan Murray, will […]
Reinstalling OSX on a Wiped MacBook Pro
I know there aren’t a lot of people reinstalling Mac OS X, but I thought I’d create a post just in case you run into a situation that deems it necessary. Here’s how to reinstall OS X on a wiped Mac: Power on and hold Ctrl+R immediately until a globe icon appears Connect to a […]
2014 FIFA World Cup Visualized in Tableau – Group G Outcomes

If you cried as much as I did as the U.S. Men’s National Team settled for a draw against Portugal last night, then you’ve probably spent your Monday pouring over the slew of scenarios for the last match against Germany on Thursday. Nate Silver and his team at FiveThirtyEight wrote a great article on the […]
Thoughts on Alteryx Inspire 2014
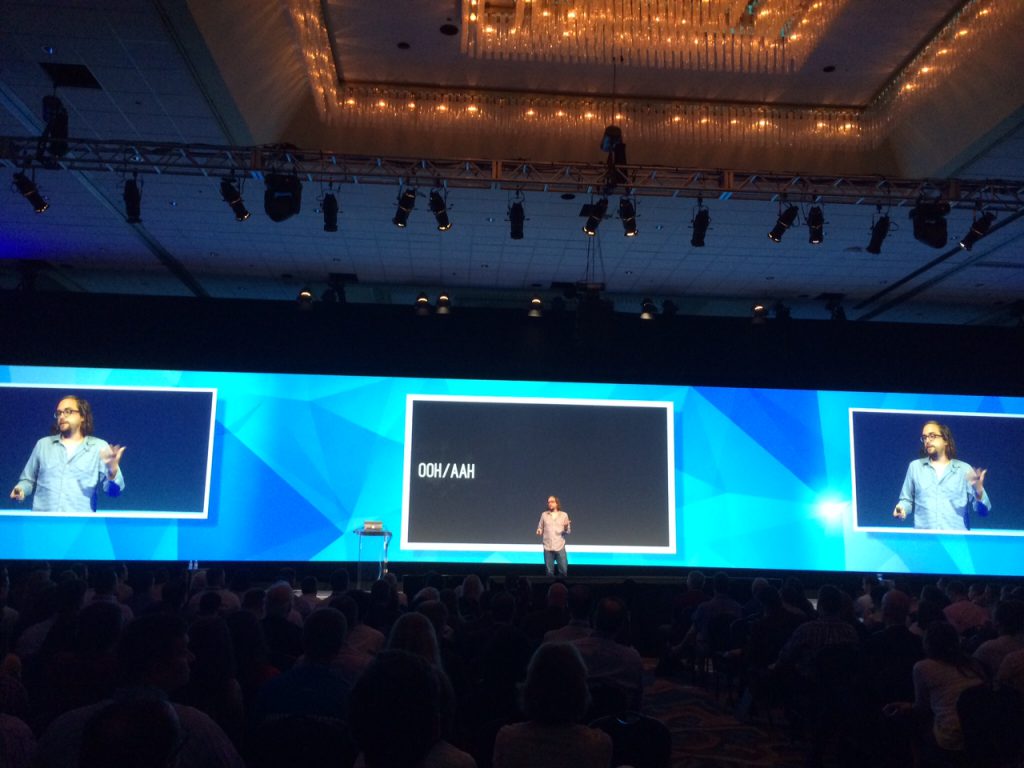
Last week, I had the opportunity to attend the Alteryx Inspire 2014 conference in San Diego. The show was well-presented by Alteryx and conveyed a very consistent message of “data for the people.” I’ve attended many conferences over the past 25 years, and I have to say that Tableau Software puts on the best show […]
