Metric Insights & Push Intelligence – 4 Ways to Add Insight to Tableau
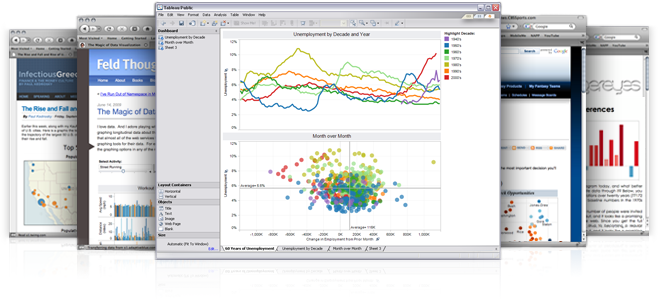
Metric Insights is booming. They are growing year by year at a blistering rate of 300% in customer acquisition with some of the biggest names in business. These names include Barnes & Noble, United and more. So, what does Metric Insights offer that Tableau Software does not? Push intelligence is the answer. Metric Insights is […]
Comment Your Code in Tableau!
In my recent blog post, “Using Comments in Tableau,” I described how to create a comment that would display as a tooltip when you hover over a dimension or measure. There is actually another kind of comment that I think is equally useful – the calculated field comment. Creating a Calculated Field Comment It’s pretty […]
3 Ways to Preserve ‘Percent of Total’ within Filtered Dimensions
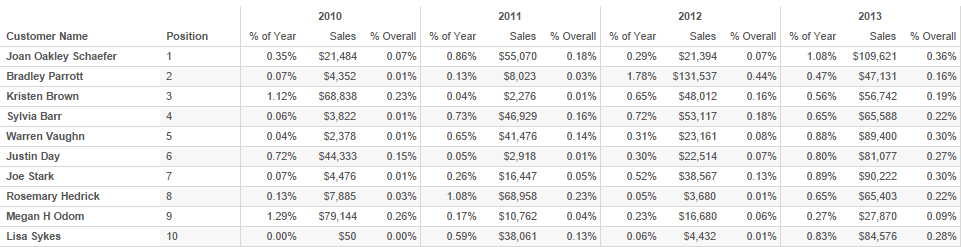
Frequently in my training classes, a student will ask: “I made a view that shows my percent of total sales, but when I apply a filter, the values change. Why is this happening?” Today we’re going to examine what’s happening here and three ways to keep those percentages within your filters. Problem Explained: Below, I’m […]
Not Applicable is Applicable – Handling ‘N/A’ in Tableau Mapping
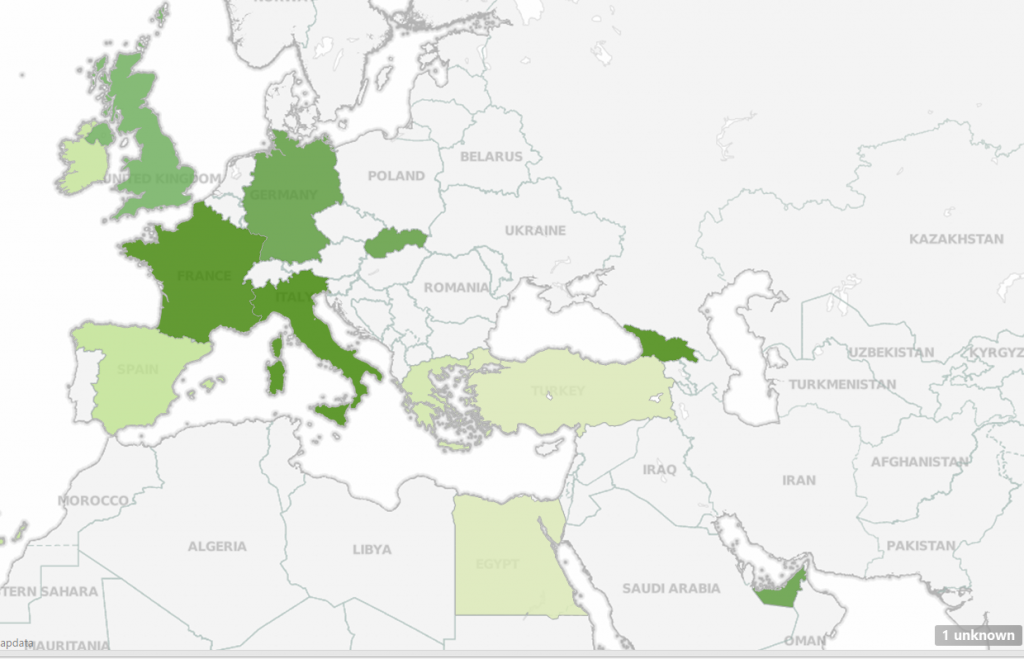
Tableau’s “out of the box geocoding” functionality creates a wealth of opportunities for users to create beautiful maps almost instantly. This is continually one of the most “in-demand” sections for students who have attended my Tableau trainings. There are few other software applications which are this flexible and quick to build in geospatial analyses, and […]
What Is a Window Function and Why Should You Care?
You might be familiar with aggregate functions in Microsoft SQL Server. These functions give you a way to aggregate your data, for example: a sum of a numeric value grouped by one or more fields in your result set. A common business requirement might be to create a result set that shows for each record […]
How I Went from InterWorks Customer to InterWorks Business Intelligence Analyst
For as long as I can remember, I have always loved talking in front of groups of people. Whether it was giving the speech at my high school graduation or taking a public speaking course at Hamilton College, the thrill of having the attention of the room and sharing a story with an audience is […]
Workbook SDK Graduates Beta, Workbook Tools Enters Beta
Tableau purchased Power Tools in 2019. Contact Us for more information. It’s been a busy few days for the Power Tools for Tableau team and the Tableau community as a whole. Our developers have worked their tails off to finish the first of many incredible Power Tools for Tableau – the Workbook SDK. After months […]
Kevin Durant and the OKC Thunder Get the Assist from InterWorks
What a wild few days for both Oklahoma basketball fans and our team of IT professionals. The OKC Thunder contacted InterWorks late Friday afternoon with an urgent need to support a high-demand team media event. The OKC Thunder have their own capable IT staff, but this team is very busy preparing for all other aspects […]
5 Secrets to Improve Tableau Productivity
I can’t help but analyze every part of my life. At this point, it’s deeply ingrained into my psyche. I even jumped on the latest fitness tracking craze to measure my activity level. For those that want to know, I use a Jawbone Up. This is largely because of the easily accessible CSV files to visualize in […]
Using Comments in Tableau
There’s something you can do to make your data easier to work with in Tableau, and I bet you’re not doing it. I love sharing this tip when I teach Tableau. Right-click on any dimension or measure in the Data pane and choose Default Properties > Comment. You’ll be presented with a text editor where […]
