The Countdown To Tableau on Tour: London
It’s 24 days to go until the biggest Tableau event in Europe – Tableau on Tour: London. If you’re a seasoned conference veteran you’ll know these events are huge. And this year is special because it was the first time the European event was split into three – The Hague, Munich and London. This gave […]
2014 FIFA World Cup Visualized in Tableau – Group Stage Travel Distances & Team Stats
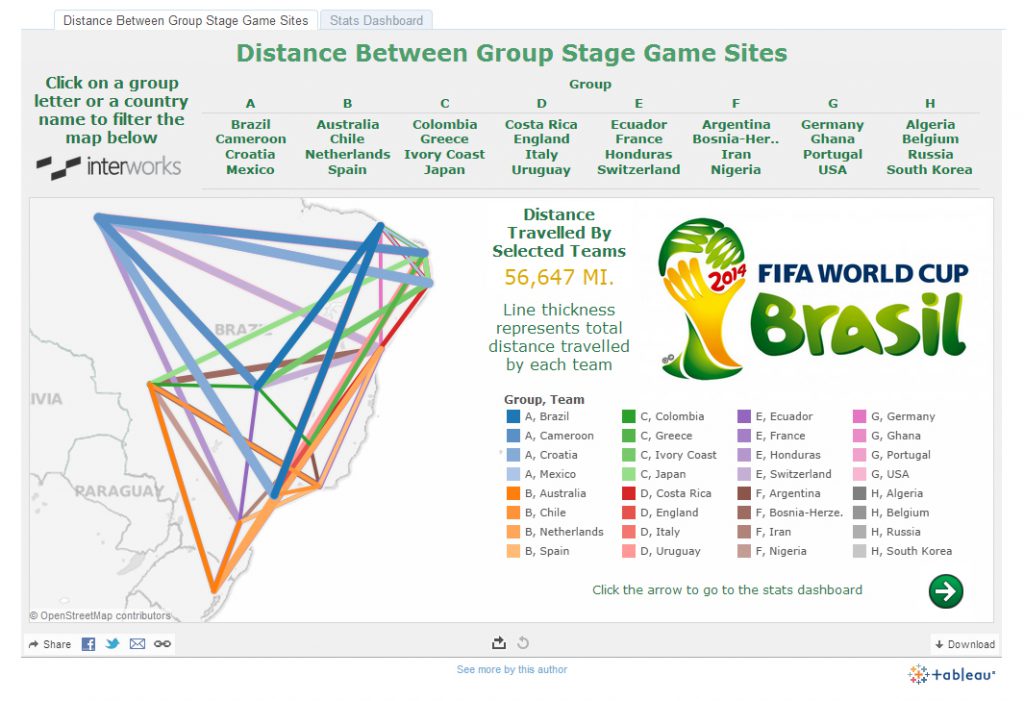
The 2014 FIFA World Cup is quickly approaching. Just like with the Olympics, it is our duty to gain as much knowledge about the event as possible. That way, we can sound smart and cultured to our friends and coworkers. These dashboards should help you to cover some key talking points and will let you […]
Extreme Viz Makeover: Electric Power in the U.S.
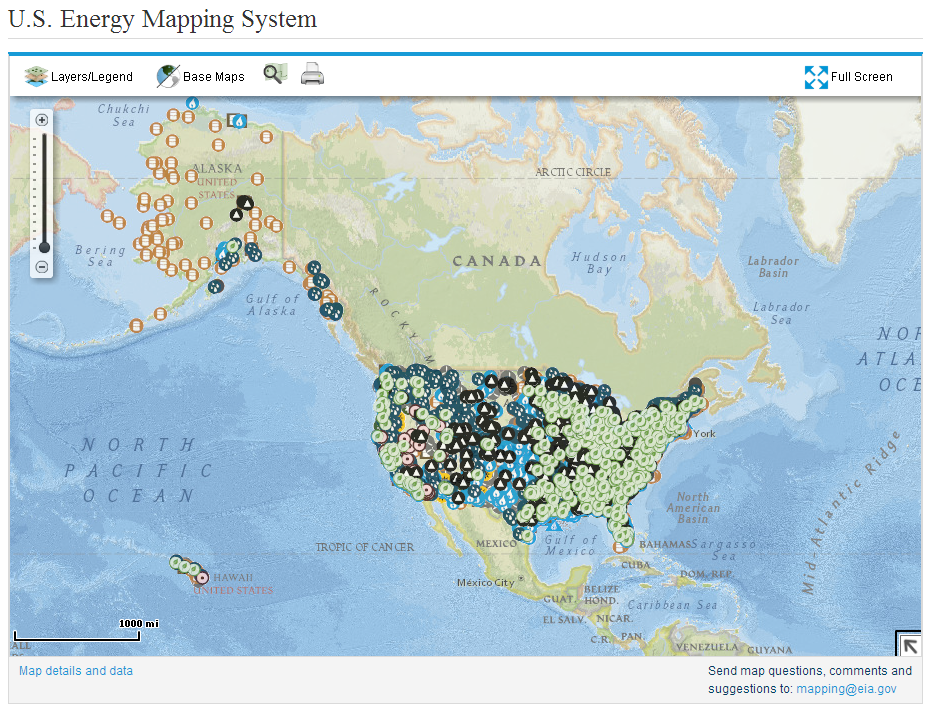
There are people living in America today who did not have electricity in their home growing up. It cannot be overstated how much the power industry has changed since then. To understand and communicate those shifts, we turn to data. Some have done an outstanding job visualizing this information, particularly this map by NPR. Others […]
Tableau Essentials – Measures & Default Properties

In this article, we are discussing setting custom properties on your workbook measures. You can find your measures in the lower half of the Sidebar, also known as the Data Window among regular Tableau users. Why Set Default Properties? Tableau does a pretty good job of figuring out which fields go where and how they […]
Faster Data for Tableau: 3 Killer Features in SQL Server 2014

I’m a huge fan of Microsoft SQL Server. It’s a very user-friendly database with a wonderful tool stack, making it a perfect fit for many data warehouses that feed data to your Tableau users. The latest release, SQL Server 2014, gives us even more things to be excited about. Though there are a bunch of […]
10 Ways to Drive End-User Adoption of Tableau – Part 2
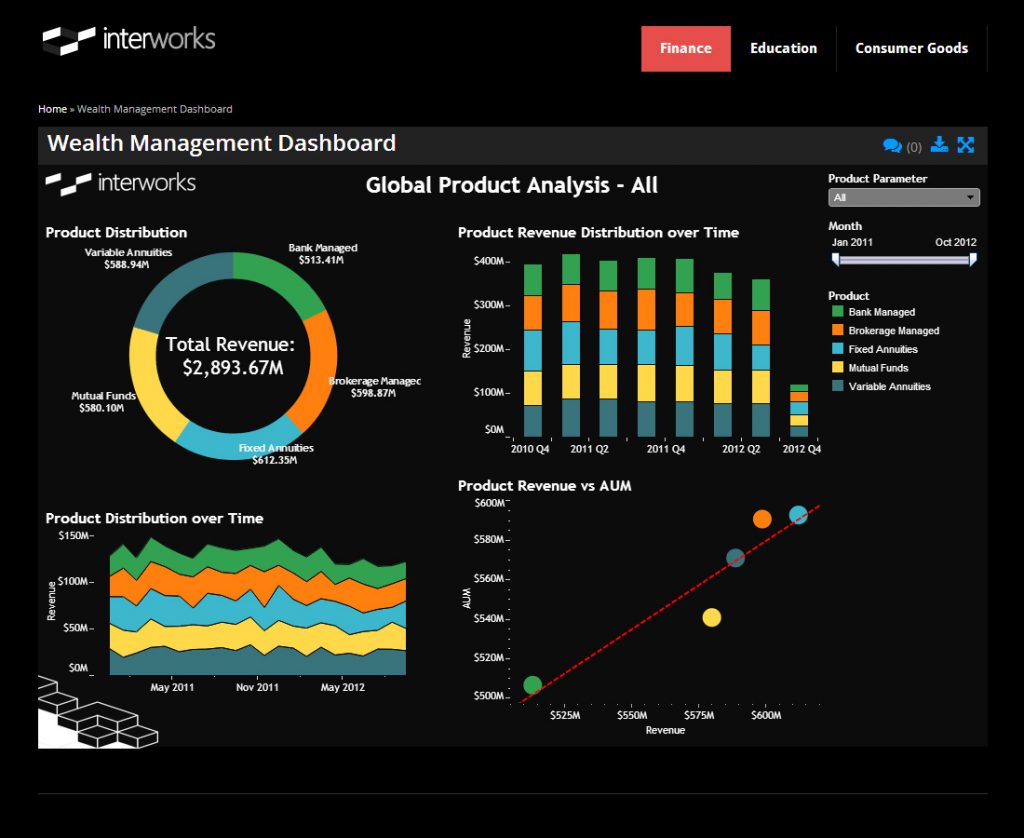
Ready to pick up where we left off? Last week, I posted “10 Ways to Drive End-User Adoption of Tableau – Part 1.” This week, I finish things off with Part 2. In this piece, I cover the remaining five ways in which you can bolster end-user adoption of Tableau. Let’s get started. Adapt Design […]
Connect Ruckus Access Point to ZoneDirector through Command Line

There are several ways to connect an already configured Ruckus Access Point to a ZoneDirector manager. If the device is on the same subnet as the ZoneDirector, the director should see the device automatically. If the device is not on the same subnet and can communicate to the ZoneDirector’s network, you can connect the device […]
Tableau Essentials – Worksheet Canvas

The Worksheet Canvas For the Tableau Desktop Interface (see Figure 1), we have covered the Toolbar and the Sidebar. Today, we will examine the rest of the worksheet, focusing on all of the options and controls from the Worksheet Canvas. Figure 1: Tableau Worksheet. Cards & Shelves We’ll only do a quick overview here, as […]
Don’t Take NULL for an Answer – Make Tableau’s ‘getWorkbook()’ and ‘getActiveSheet()’ Functions Behave Correctly

NULL errors have cropped up twice in recent development projects utilizing Tableau’s JavaScript API. In one instance, getWorkbook() returned this error: SCRIPT5007: Unable to get value of the property ‘get__workbook’: object is null or undefined In another instance, getActiveSheet() returned this error: Uncaught Error: Internal error. Please contact Tableau support with the following information: Unknown […]
Tableau Essentials – The Sidebar

Today we continue exploring Tableau’s interface. We will focus on the functionality and features of the Sidebar, commonly known as the Data Window among Tableau users. The Sidebar The Sidebar is located on the left-hand side of the Tableau worksheet (depicted in Figure 1 below), just beneath the drop-down menu options and the Toolbar. Figure […]
