In this article, we are discussing setting custom properties on your workbook measures. You can find your measures in the lower half of the Sidebar, also known as the Data Window among regular Tableau users.
Why Set Default Properties?
Tableau does a pretty good job of figuring out which fields go where and how they can be used in your data visualizations. Sometimes, you can add additional information that will make Tableau even more effective. Measures are numerical fields that can be used in aggregation, but not all measures were meant to be simply summed.
For instance, assume that your data source had a field labeled, “Profit Margin.” Clearly, this is a measure and not a dimension, but would it make any sense to sum your Profit Margin like you might your Total Sales Revenue?
Nope. That’s why editing the Default Properties is so important, because it gives Tableau a clue as to how to use your data better and, wait for it, save you tons of time in the long run.
Changing the Properties
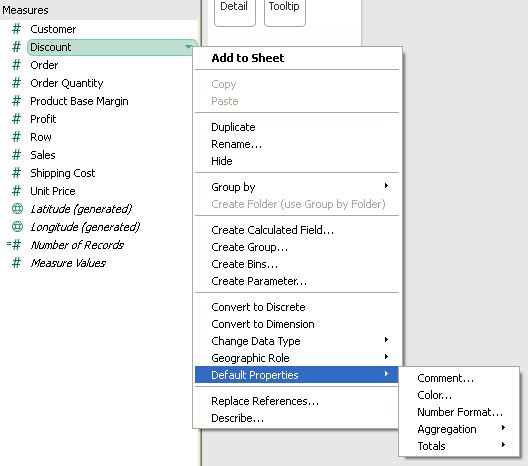
You can access the Default Properties menu by simply right-clicking on the measure you wish to adjust or by pressing the down arrow icon when the measure is highlighted. See Figure 1 as an example.

Figure 1: The Default Properties menu.
You have five different options under the Default Properties menu. The two that we will focus on in this article are Number Format and Aggregation. The remaining three are summarized below:
- Comment: Adjust the Comment option to change the tooltip that appears when you mouse over the selected measure. You might use this to note any Default Properties you have changed for this field.
- Color: This sets the default color or color scheme of the measure whenever it is dragged and dropped into your visualization.
- Totals: Totals sets how the field is treated in a Totals field, which can be added to your table by going to the drop-down menus: Analysis > Totals.
Number Format
Number Format does exactly what it sounds like and has the same equivalent in nearly every other data program. You can set sales data to Currency and specify the type of currency, the number of decimal points and even how it is represented as a negative number.
For example: -$200, ($200) or $200 are all means to convey negative two hundred dollars.
Another useful number format that you will frequently encounter is the Percentage format. The Profit Margin example that we opened this article with is a perfect example. Again, how a percentage is presented in your worksheet is fully customizable.
Aggregation
This controls how the measure is aggregated within a worksheet. Some numbers are perfectly designed to be summed, such as revenue or profit numbers. Others require a bit more finesse, and that’s how you can help Tableau.
Profit Margin or Discount percentages might be best displayed as an average. CustomerID, while a numeric field, has no value as a sum or an average. It is much more useful to see CustomerID as a count of records.
There are many options that you can test and use to extract the most relevant and compelling story from your data.
One More Thing – Rename
In the same right-click menu that you used to find Default Properties, there is another option that reads “Rename.” This is immediately helpful to note specific properties of your adjusted measure. For instance, in the Profit Margin example above, you could change the name of the property from “Profit Margin” to “Avg. Profit Margin %.”
That change immediately lets you know the nature and use of the field. It is often a more effective option to convey the changes in the Default Properties than the Comments options.
Conclusion
One of the most powerful things about customizing the Default Properties of your measures is that you can then save your edits in a packaged Tableau workbook (twbx) or as a data source (tds). That way, the Default Properties that you changed are then applied to all of your worksheets and your dashboard going forward.
Want to learn more about Tableau? Here are the other Tableau Essentials posts we have so far:
- The Toolbar (Interface)
- The Sidebar (Interface)
- The Worksheet Canvas (Interface)
More articles are coming soon, so check back regularly.
As always, let us know if you have any questions or comments about this post or Tableau in general. If you’re looking for personalized training or help with something bigger, contact us directly!


