Introducing the Snowflake Data Cloud: How We Got Here

Five years ago, in the distant past that still included large, boozy, in-person technology conferences, I met two guys from an upstart cloud data warehousing company called Snowflake. Walter Aldana and Uday Keshavdas were those two guys, and while they are both great and were passionate about Snowflake, I was unconvinced at the time. I […]
What’s in a Name vs. When Is a Name? A Data Viz
Depending on your age (and many other factors), when you read the phrase “What’s in a name?” you may think of one of two things: A soliloquy from Shakespeare where Juliet bemoans, “What’s in a name? That which we call a rose / By any other word would smell as sweet.” A lyric from The […]
Take Control of Your Chart Labels in Tableau

Oftentimes, we want to show the labels on charts, but there may be cases where we need more flexibility than the default options Tableau provides. For example, we may only want to label the most recent data points or select points of particular interest. In this post, we will see how you can get full […]
Our Favorite InterWorks KPI Designs from 2019-2020
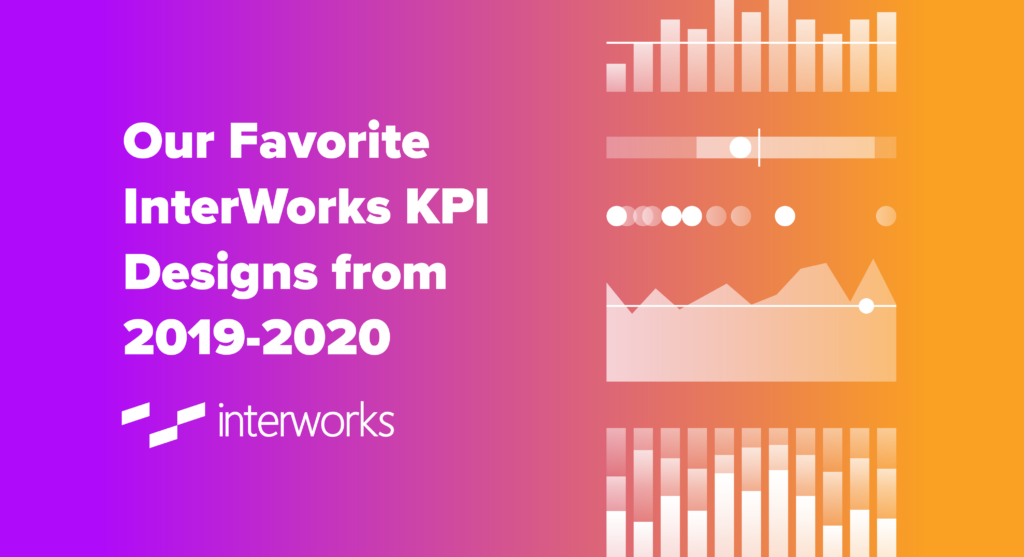
Even though we’re nowhere near the end of 2020, my colleague, Skylark Macadamia, recently began thinking back on what some of her favorite InterWorks KPI designs have been over the past year. The UX and Design team at InterWorks has worked on numerous Tableau projects and dashboards during this time, so there was a wealth […]
Portals for Tableau Feature Expansion: Content Tracking
While we definitely recommend using a web analytics tracker, such as Google Analytics or Matomo, to track usage of your portal, the portal itself does record each time a user visits a piece of content. It uses this information to generate things like recommended content, recently visited content, most active users, etc. Feature Expanded Originally, […]
InterWorks Supports the Launch of New DataWomen Community
We’re pleased to announce that InterWorks is supporting the launch of a new data community! DataWomen is a network that will host regular webinars, run a mentoring program, host a LinkedIn group and share awesome content and links for other groups. Learn more at the DataWomen page. Celebrating the Community of Women in Data The […]
Webinar Replay: Tableau 2020.2 Feature Demo: New Data Model

The latest version of Tableau, 2020.2, introduces a game-changing new data model. This feature provides you much more flexibility and changes the way you can work with the data sources. We will explore the differences in user experience when compared to previous versions. Furthermore, we will dive in and go through different scenarios: Introduction to […]
Recapping the Data Science Go Virtual Conference 2020
This year, I was asked to present a workshop at the Data Science Go Virtual Conference. The DSGO attendees included 2500+ new data scientists, and my presentation was geared toward the 200+ who were interested in learning to use Tableau for data visualization. I was super excited for the opportunity to share something that I […]
Portals for Tableau New Feature Spotlight: Content Favoriting
[cue music] Tiles on pages and bar charts on dashboards, Publishing files and tagging with keywords, Centralization through external links, These are a few of my favorite things… Keep Track of Your Favorite Things In the beginning, Portals for Tableau focused on, well, Tableau content. When it came to favoriting things in your portal, you […]
Webinar Replay: Product Demo: InterBurger – A Tableau Portal Solution

The InterWorks team would like to introduce you to one of our newest portal solutions that brings together branded analytics and faster insights for a unified data experience for users across all levels of an organization. “InterBurger” is an analytics web portal that represents a fictional restaurant chain with fictional data that demonstrates commonly needed analytic […]