
Everyone looking at a dashboard expects it to load and respond quickly. What defines “fast” varies from one person to another. As we discussed recently on our Tableau Performance episode of “Podcast Your Data!,” something that takes minutes to load could still feel fast compared to the effort it took before automating things in Tableau. No matter the benchmark, we want things to be quicker. Now, we have a performance troubleshooting guide to navigate you through the steps to improve Tableau dashboard load times.
Narrowing Down Tableau Performance Issues
We start with a simple, common question: “Why is my Tableau dashboard slow?” If we know what’s causing the slowdown, we then ask: “What can I do to fix it?” The answers fall into a few basic categories:
- Strain on Tableau Server resources
- Database responsiveness (including Tableau extracts)
- Amount of data to render
- Updating UI elements like drop-down filters
- Calculation efficiency
The Tableau Performance Checklist covers these areas, explains likely problems and offers solutions to each. But, not every part of that checklist will apply to your situation. What you need is a step-by-step guide to help you narrow down the possibilities, ignoring the things that don’t apply and focusing on the ones that do.
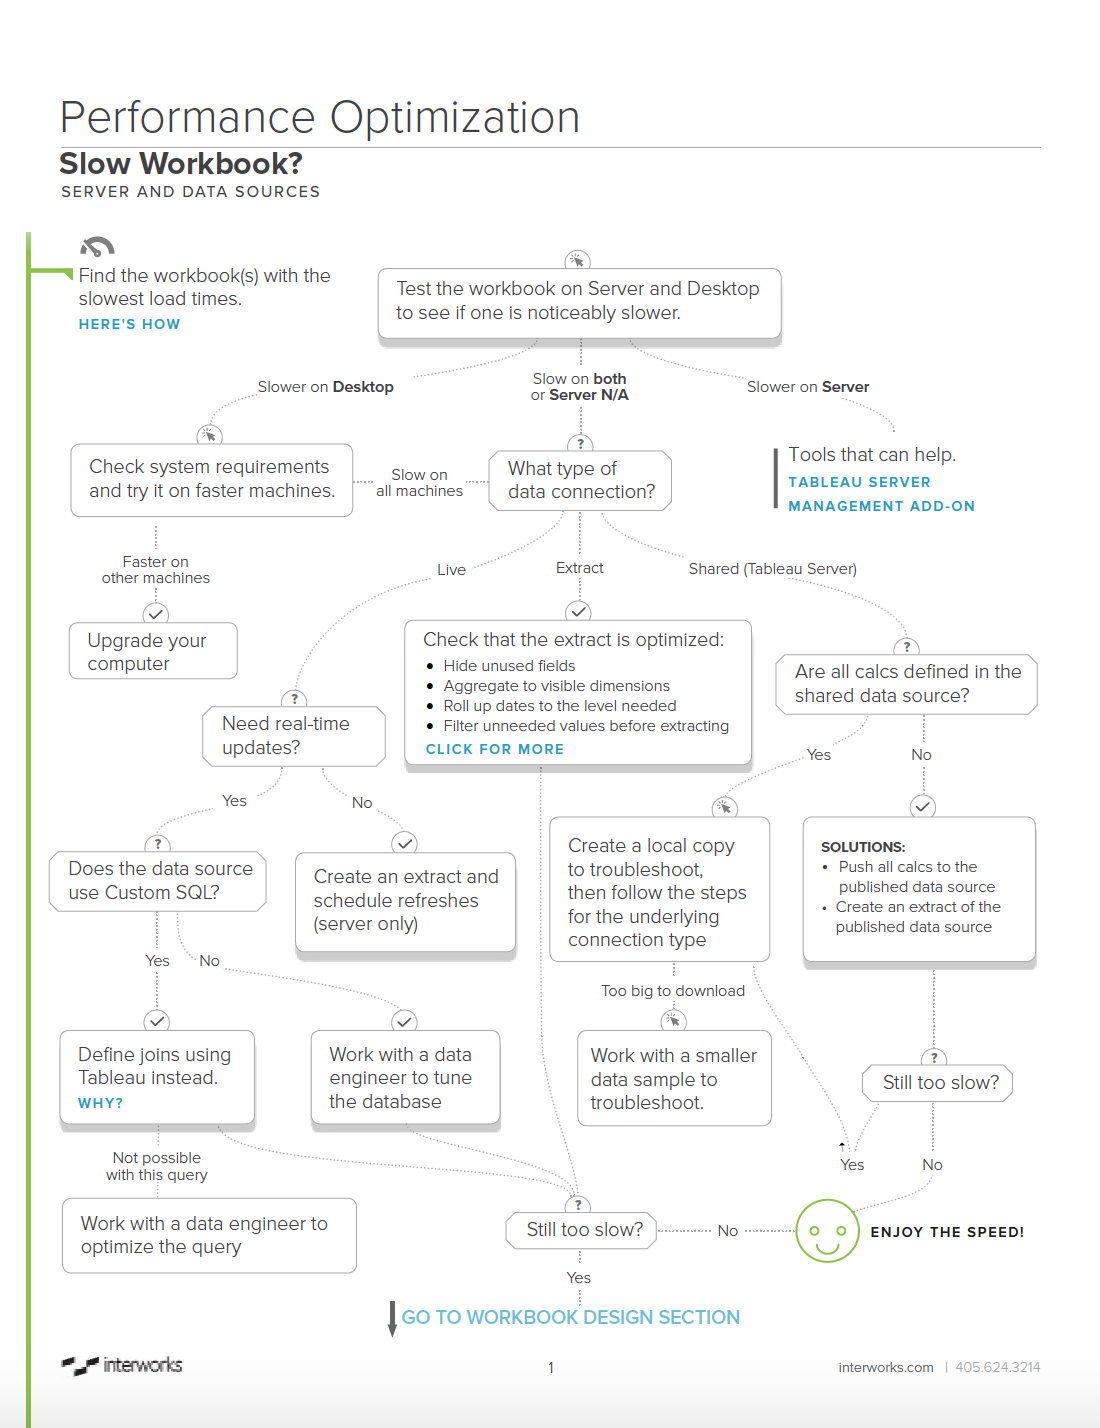
The first few steps in the flowchart help you determine if there’s a problem with the server or the underlying data architecture. From there, it helps you find issues with dashboard design, calculations and other common problems.
You can download the full PDF version of the chart, including hyperlinks to additional resources, at the bottom of this post. Here’s a quick glimpse of page one:
Don’t Forget: Load Time Isn’t Everything
I always stress to people that “slow” isn’t limited to load times. As you’re evaluating performance, don’t forget to ask yourself and your audience these questions:
- How long do people have to wait for dashboard design changes?
- How much time does it take a user to understand the data presented?
- Does it take several clicks (and wait between each click) to get the desired view?
Even if your dashboard loads in less than five seconds, you may not have solved the most important performance problems. If it takes days or weeks to change things, is difficult to use or makes the data hard to understand, then focus on solving those problems first. People will give you grace for a few extra seconds to load something if it saves them time and frustration in other important ways.
Further Reading
Anyone who designs Tableau dashboards should read Tableau’s “Designing Efficient Workbooks” whitepaper. It’s lengthy, but more than worth the time invested. The PDF version of the Tableau Performance Troubleshooting Flow Chart links to several things in the Tableau Performance Checklist, but it can’t cover every scenario. Read through the checklist and dive into the related posts for more solutions.
Download the Flowchart
That’s it! Download the full PDF version of the Tableau Performance Optimization Flowchart by filling out the form below, and don’t hesitate to reach out if you have any Tableau performance questions.