
Robert updates user-submitted Tableau dashboards with visual best practices in this series, resulting in practical before-and-after insights.
This is the first of a new series of blog articles called This Old Viz. It combines my passion for visual analytics and a desire the Tableau user community has for incorporating visual best practices with good design. I put out a request on social media for a brave soul to volunteer one of their visualizations that I could re-design—in other words, upgrade and make over their viz.
Volcanoes Version 1
Here is the original dashboard volunteered by my new friend, Danny, from a previous Makeover Monday:
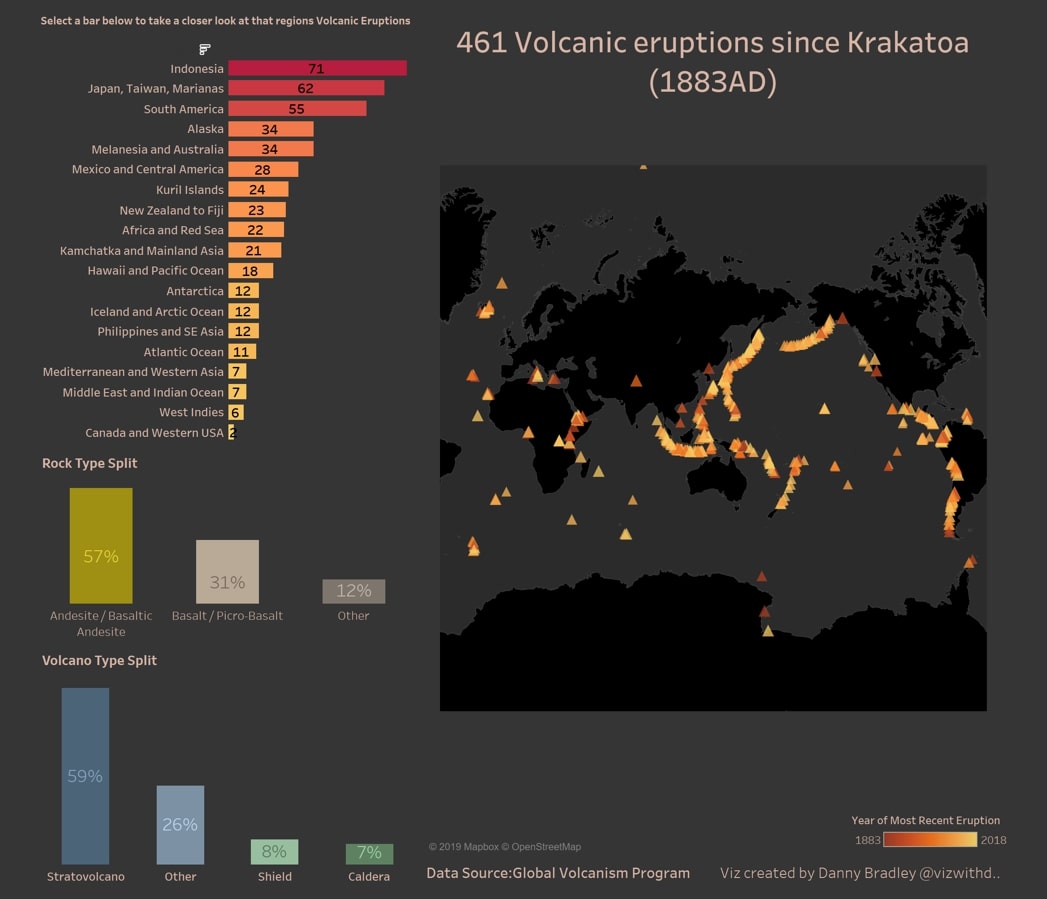
Above: You can find the original dashboard on Tableau Public
We’re looking at about 140 years of volcanic activity and breaking it down by recency, frequency, geography and geology. There’s a lot of good data here and lots of great ideas put forward by Danny. In particular, I liked using triangular shaped marks on the geographic map, which visually implies a volcano. This is a nice touch and a great use of visual best practices. I also like the dark background as it really makes the red/yellow gradient colour legend pop on the screen.
Using the map to display this information is essential. A rule of thumb is to only use maps if there is a story to tell in the geography: is there something that the location of these marks reveal that would otherwise be missed? In this case, the answer is a resounding YES! You can see the “Ring of Fire” quite obviously around the Pacific Ocean where the majority of volcanic activity occurs.
Volcanoes Version 2
When I thought about where I wanted to start, I felt that the structure of the visualization needed some refocusing. The map, a heavy component of the visualization, was not being leveraged as best it could be. Additionally, in exploring the dataset, I saw that there was more information we could include within the bar chart. So, I created a stacked bar chart to mirror the recency of eruption encoding in the map—colour.
And speaking of colour, there was too much of it across the dashboard. As human beings, we can keep about seven items in short-term memory. This viz presented seven, as well as a full colour gradient. In addition, in the map, the yellow-red gradient represented recency of eruption whereas it was volume of eruptions in the bar chart. That might be confusing for our report users that don’t read the fine print. I consolidated the colour scheme across the view.
Finally, I also thought we could use some fun bubble charts by volcano type to visually represent an aerial view of a volcano. Each bubble represents a specific volcano. I added some infographics to offer more detail as a Viz in Tooltip.
Above: My take on Danny’s viz
Thanks, Danny, for volunteering your view!
Interested in Making Over Your Viz, Too?
If you have some visualizations you’d like to expose to an extreme makeover, please let me know in the comments below. I’m aiming to do one of these every month. The only requirement is that your workbook is publicly available (i.e. data is not sensitive) so that I can share the before and after on the InterWorks blog and Tableau Public.
And for any Tableau or data needs, remember InterWorks is the best guide.