
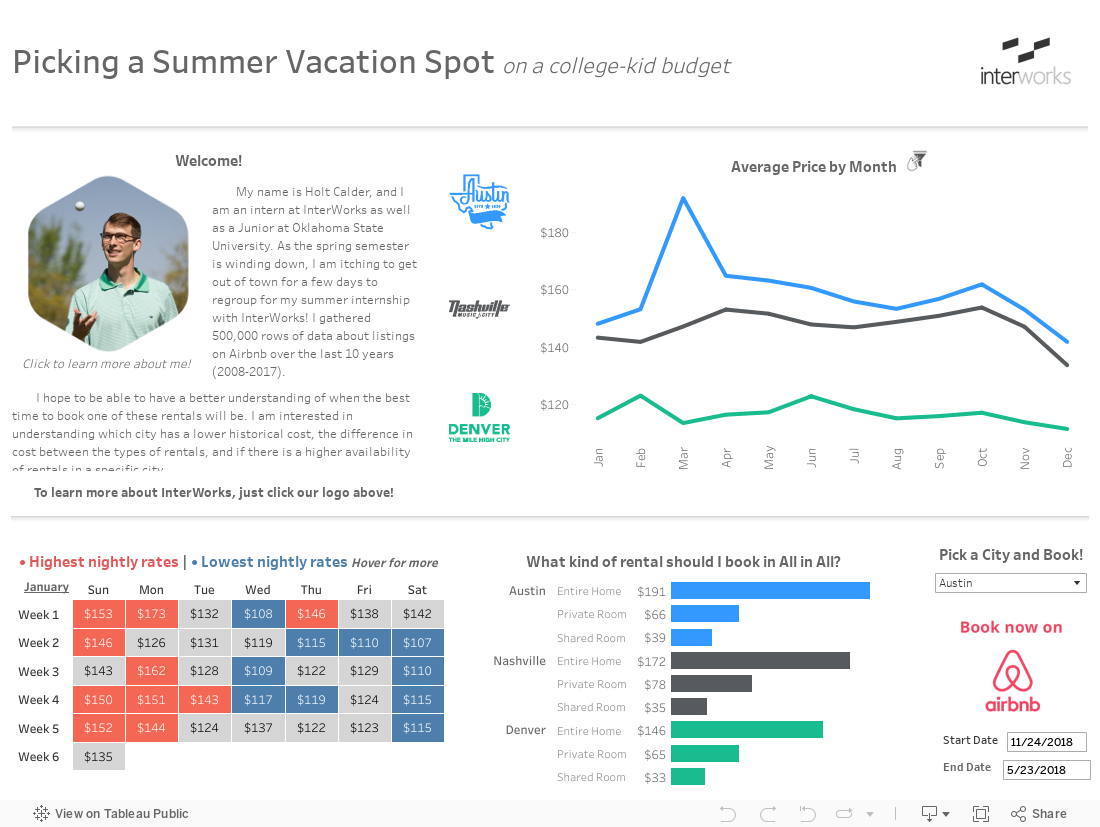
Around mid-April, I got the idea to get out of town for a few days to regroup after a long semester filled with accounting and MIS courses. I recently moved into the Data Engineering Intern role here at InterWorks, and I wanted to be ready to dedicate my full energy to the role. I thought the best way to do that was to spend some time to clear my mind and fully reset. As a college kid and millennial, I naturally love to do things I can’t afford, so I decided to plan a three-day vacation for as cheap as possible. To help me plan, I decided to dig into the data behind traveling to a handful of locations. Using Tableau, I was able to create a data visualization of my findings. Check out the dashboard below, then read on to see how it all came together:
Data
To pick out what locations to analyze, I looked at a few cities that were drivable from Stillwater, Oklahoma. This lead me initially to look at Austin, Texas, Nashville, Tennessee, New Orleans, Louisiana, Chicago, Illinois, and Denver, Colorado. From this list, I narrowed it down to Austin, Nashville and Denver to build a dashboard around. After figuring out what cities I wanted to learn more about, I discovered insideairbnb.com. The site specializes in obtaining raw data from Airbnb for further analysis. Their site contains quite a few visualizations itself but also allows you to download the text files from http://insideairbnb.com/get-the-data.html. I opted to download data for each of my destinations from 2007-2017.
Analysis
After pulling the three CSV Files into an Excel workbook as individual sheets, I created a “Master Sheet” containing the city names to create a join within Tableau. Since the data relating to the cities all shared similar attribute names, I performed a union in Tableau to clean it up and make it usable. After the data was pulled into Tableau, I started understanding more about what kind of rental I could get in each city.
Being from Texas, I had pretty much anticipated going to Austin for the nine-millionth time. All jokes aside, I’ve visited Austin probably ten times and based on the small budget I was working with, I was unsure if Denver or Nashville would be realistically attainable. After looking at the data, the situation ended up being completely reversed. Austin is, on average, $20-40 a night ($60-$120 over the course of my trip) more expensive than Nashville or Denver. That adds up quickly, especially considering I would be eating a majority of my meals away from the Airbnb.
After doing some more digging, I found out that during the month of May an Airbnb in Denver is practically the cheapest it will be for the entire year. Considering I started work on May 21 and only had availability to leave town from May 14-16, this met my needs perfectly. In addition to this, displayed in my donut chart, Denver has the highest quantity of available listings during this time frame. After inputting my trip dates and selecting Denver on my Pick a City and Book! URL dashboard action, I had found a rental in under 30 minutes.
Trip
The trip was awesome! The driving distance to Denver was about 650 miles, and it took nine hours to get there. If I had chosen to go to Austin, it would have cost me roughly $60 more than Denver and the driving distance was about the same. Having that extra cash made the trip so much more enjoyable. I went to look at Red Rocks Amphitheatre and spent most of my time in the LoHi neighborhood enjoying the weather and planning out how to get the most out of this summer as a Data Engineering Intern. Here are a few pictures from the trip:


Some Final Thoughts
By far the best part of this entire experience was getting input and feedback from the rest of the team at InterWorks. From my initial layout of this dashboard, I was able to exponentially enhance its functionality due to ideas from people like Russ Lyman, Derrick Austin, Sidd Suresh, Will Jones and Katie Wagner.
From raw data to dashboard, there was an expert available every step of the way (there was even a situation in which Eli Sprague had to help recover the dashboard from a dead hard drive for me) to bring this to completion. Whether it’s IT or analytics, there is always an internal expert who is available and willing to help, which is invaluable for an intern coming in. I also believe that’s the reason InterWorks continues to provide value to our clients.
Keep up with me and my work on the blog this summer. I would also love to connect with any of you on LinkedIn (here). If you have not had the opportunity to visit Denver, I highly recommend it. Plug in your dates on the dashboard and pick out your place!