
Do you like being challenged? Is passing the Tableau Desktop Professional Exam (CP) on your to-do list? Then this blog might be handy. I recently became a Certified Tableau Desktop Professional and want to share a few tips to help you prepare.
Getting Started
Your best source of information is the official Tableau guide. There, you can find an exam prep PDF with a test and a link to a sample workbook that will give you a very good benchmark. In order to take the exam, you need to be a valid Desktop Certified Associate (CA). The details of the CA test can be found here, with specifics on how to pass that particular exam here.
The exam environment is very similar to Desktop Certified Associate: you will be using a virtual machine, and a proctor can interrupt you at any moment (which happened twice during my exam). Unlike the Certified Associate, the CP exam isn’t multiple choice. You need to build visualisations in order to answer the questions, and your answers are entered in as free text. The exam length is three hours, and you can’t leave your seat during the exam, so I recommend having water, coffee or something else to stay hydrated.
Tableau Courses to Help You Prepare
From my perspective, taking the Desktop III and Visual Analytics courses lays a solid foundation for the CP exam. I found some of the examples and wording in these courses to be very similar to the CP test questions. It can be beneficial to take one of these courses a few days before the test. These courses not only deepen your Tableau data visualisation knowledge, but they also help you become a better data analyst. Both will teach you different methods to visualise data and help you with best practices.
In addition to the links mentioned above, there are many blogs and free resources available to aid you in your test preparation.
What to Expect and Helpful Resources
Check out this Tableau page dedicated to data visualisation. Here, you can find explanations of poor and great visualisations, as well as guidance surrounding typical data questions, including the most suitable type of analysis and chart to answer them. For example, scatter plots are great for identifying correlations, and when comparing KPI performance against target, a bullet chart is effective. During the exam, it’s handy to quickly apply this knowledge. You won’t have much time to explore different chart options.
You can expect advanced table calculations. Here are several blogs I found very helpful to refresh my knowledge and practice:
- List of table calculation functions with examples by Tableau
- The Tableau Deep Dive series by Robert Curtis was a great help in my Tableau journey in general but also specifically when preparing for CP exam.
- Top 10 Tableau table calculations with workbook examples
There will be Level of Detail expressions and at least one example with nested LODs. Below are some blog posts I found useful:
- Top 15 LOD expressions with workbook examples
- Tableau nested LODs by Ana Yin
- More examples can be found here (thank you, Tableau) and here (thank you, InterWorks)
Most probably, you will need to use parameters in several exercises, and be sure to have a good grip on joins, unions and blends. I needed to create a join calculation in my test.
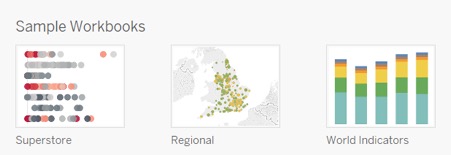
Formatting is a very important part of the exam. Try to work on titles and tooltips as you go. Another good tip is to set up the formatting on a workbook level at the start of the exam. In addition to this article, which provides guidance, I recommend checking out the sample workbooks that come with your Tableau installation (World Indicators, Regional and Superstore). In these workbooks, you can see what charts Tableau uses to answer different questions:
Timing
The exam is three hours long, which may seem like a long time, but trust me, it is not! That time goes incredibly fast, especially when you’re focusing so hard. Keep track of the time, and give yourself strict guidelines when doing each section. You will likely leave the exam thinking, “I could have done this part better and that question in a different way.” Everyone I know feels the same. I don’t think I know anyone who has left the exam feeling 100% happy with their final work. You’re on a very strict time schedule, and Tableau isn’t expecting a perfect outcome.
To prepare, I’d recommend reviewing some existing visualisations and transforming/building them in a different way while adhering to a strict time limit. Give yourself some time at the end to review everything and then at least five minutes to submit your work (sometimes the upload can take a little while).
Exam Structure
The structure of the exam is very well explained in the exam guide, but here are the three main components:
- Module 1 – Visual Best Practices: You’ll be given a chart and asked to rebuild it to better answer the question.
- Module 2 – Advanced Technical Skills: Application of table calculations, LODs, parameters, etc.
- Module 3 – Storytelling: You will be given a use case and asked questions for which you will need to build several visualisations. The end result of this part will be a Dashboard and a Story. You will need to apply all of the above. It’s not mentioned in the latest exam preparation guide, but Storytelling used to give the most points. Therefore, I recommend starting with Module 3 and reviewing it again at the end if you have time.
You can find great suggestions on how to prepare for the Storytelling module in this blog post. Try to work on different datasets and use cases. Participate in Makeover Monday, Workout Wednesday, Storytelling with Data challenge and similar projects to sharpen your skills.
Good luck with your preparation, and I hope to see the same certificate with your name on it. Please let the community know if you find more useful tips. Special thanks to Mavis Liu for her contribution to this blog post.