
10 Questions is an ongoing blog series in which Tableau Zen Master Dan Murray interviews some of the brightest folks in the world of data.
Last summer, I was invited to speak for the Boston Tableau User Group at the Broad Institute. This was a different crowd, composed of mainly scientists. There were two Zen Masters in attendance: Chuck Hooper and Jonathan Drummey.
Prior to my speech, I had the good fortune to see Nicole Nichols, Ph.D., present a talk on her use of Tableau to support DNA polymerase development. This was a use case for Tableau that I hadn’t seen before.
The Questions
Q: The company you work for is called New England Biolabs. What does NEB do? Who do you serve? What kinds of products and services do you provide your customers?
Nichols: NEB develops and manufactures a wide array of life science products, including molecular biology reagents. To those not familiar with molecular biology, I usually describe these products as the molecular equivalent of items you might find in a primary school – scissors (nucleases), glue (ligases), a photocopier (polymerases), etc.
These products are used across academia and industry by scientists and engineers working with DNA to enable discoveries in numerous fields.
Q: What does your role as Senior Applications Development Scientist entail?
Nichols: I supervise a team in our Applications and Product Development Division focused on the development of polymerase products. Polymerases come in many different flavors and can be used in a variety of common laboratory techniques. By far, the most common laboratory technique involving polymerases is PCR
Q: In layman’s terms, what is PCR?
Nichols: The polymerase chain reaction, PCR, is a process by which small amounts of specific regions of DNA are copied. Because each copy can also be copied, there is an exponential increase in the amount of DNA produced in this process.
This polymerase-dependent process is an important first step in many modern diagnostic tests (to test for the presence of infectious material, contaminants, etc.) since small amounts of DNA are typically too difficult to detect in the absence of an amplification step.
Q: How are polymerases used in the cell?
Nichols: In living tissues, DNA polymerases are part of large complexes of proteins that have the crucial job of faithfully copying our genetic material such that it can populate new cells or be passed down to offspring.
Mistakes (mutations) are generally undesirable, so the cell not only depends on these high-fidelity polymerase complexes but also has a variety of error-checking and repair machineries to ensure that DNA is faithfully replicated.
Q: This Tableau visualization on your website (Figure 1) compares the purity and yield of different products. How did Tableau improve the visualization of this data?
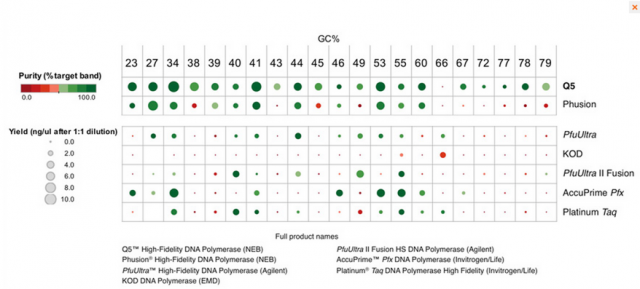
Figure 1: Tableau visualization comparing purity and yield of different products.
Nichols: As we were looking for ways to compare various polymerases, we were running hundreds and thousands of PCR experiments in triplicate. Historically, the output of these reactions is visualized using a method that essentially separates DNA into bands of distinct sizes and stains the bands such that larger amounts of product can be visualized more clearly than smaller quantities. Simply, the desired output is often referred to qualitatively as a “big, fat band” of DNA.
When my group first undertook the challenge of reinventing the way we assess polymerases, I knew we’d need to swap this assay for something with a higher throughput that also yielded a more quantitative output of the amount of DNA produced in a reaction (yield) and the reaction specificity (purity).
We achieved that but then quickly realized that our ability to acquire data had outpaced our ability to analyze it. It was out of necessity that we investigated alternative visualization methods. The graphic isn’t something we designed for marketing purposes after the fact, but instead represents a way of visualizing our data that enabled us to make the decisions that drove our development process.
Q: Are you also a database expert? A data visualization expert?
Nichols: When I first undertook this project, I was definitely not a database expert. I do love solving problems as well as designing methods and systems that can be used to inform decisions. Science in general, and product development in particular, leverage these skills in ways that keep me engaged and passionate about my work.
I’m a very visual person, and because I need to see things to understand them (and decide what to do next), I’ve found that I’m reasonably good at creating visuals that others find compelling
Q: How was Tableau first deployed at NEB? Is Tableau used for science and business applications at NEB?
Nichols: Not being a database expert myself, I hired a team member, Brad Langhorst, who brought this expertise to the group. Along with his scientific background, Brad also had previous experience with Tableau.
When our initial data analysis methods (based on lots of Excel sheets and a love of Igor Pro that I brought to NEB from graduate school) could no longer keep up with our pace of data collection, he suggested that it might be time to investigate Tableau.
At the same time, we were struggling with data analysis around polymerase development while the IT team was investigating alternative ways to visualize our core business data.
The IT team was open to bringing Tableau into NEB and allowed us to serve as a test case for in house use. Now Tableau drives the executive dashboards across our organization and a second scientific group has embraced it as their chief data visualization tool
Q: Are their any new capabilities that you would like Tableau to add to it’s toolset?
Nichols: Because Tableau was initially targeted for business use cases, there are some simple science-focused features that would improve its utility for our use case. For example, we were very pleased to see the introduction of error bars. In future iterations, it would be helpful to have more control over their position and style.
Also, we’d love to be able to have more control over the hover dialog boxes (i.e. an ability to display an image representing raw data when hovering over a data point). In our workflow, we enable Tableau to “write back” information to our database (e.g. marking results as questionable); however, we’ve had to do this using URL actions. It would be helpful if there were other supported alternatives.
Q: How do you view data visualization as a tool for furthering research, product development, and quality monitoring?
Nichols: It’s absolutely crucial. Good visualizations lead to an increased understanding of any system – not only by clarifying expected results but also by illuminating the “blind spots” of unexpected results or trends. If you can’t see what you’re data is telling you, how can you possibly make decisions about how to move forward?
Q: What exciting new trends are happening with either polymerases or PCR?
Nichols: Some fascinating new work in this space includes the development of non-invasive prenatal tests (NIPT) as an alternative to amniocentesis and the detection of cell-free circulating tumor DNA for cancer detection and progression analysis.
Both areas are based on the emerging understanding that under some circumstances, DNA fragments circulate in our bodies and can be detected (using various polymerase-dependent assays) in bodily fluids.
The ability to monitor or assess health using less invasive techniques than amniocentesis or tumor biopsies is not just an exciting use of polymerases but also represents a significant potential impact to human health.
Discover More Interviews
Want to read more insightful interviews like this one? Then you’ll love our 10 Questions blog series. Check out the full list of interviews here, and stay tuned for new additions.
Need Help? Let Us Know!
There you have it. If you need help with your data infrastructure or Tableau, we have the experience, skill, and knowledge to insure your success. Contact us today to learn more.
If you’re in college and think you might want to get into this game, head to our Careers page and apply for one of our open jobs. We’d love to hear from you.