
Tableau Driver's Ed is a blog series in which we explain InterWorks' unique take on Tableau Drive, a new methodology for enabling self-serve BI in the enterprise.
Tableau Driver’s Ed is a new blog series in which we explain InterWorks’ unique take on Tableau Drive, a new methodology for enabling self-serve BI in the enterprise. For the full list of posts, check out the Tableau Driver’s Ed channel.
“Data, I think, is one of the most powerful mechanisms for telling stories. I take a huge pile of data and I try to get it to tell stories.”
– Dr. Steven Levitt, Economist and author of “Freakonomics”
If you’re a data junkie of any sort, few words are likely more relevant to your relationship with data than the above quote. Data is full of stories, and it’s up to us to dig them up. Fortunately, this discovery process has gotten a lot easier over the past few years thanks to some major developments. First, increased data production and the democratization of IT has created an incredible amount of power and freedom for organizations of all sizes. Second, the emergence of dope data visualization tools like Tableau Software has given us the ability to translate all of that readily-available data into engaging pieces of visual storytelling.
So, we’ve got more data, more access and better tools. Those are all great things, but they don’t necessarily guarantee success when extracting value from your data. Those who are successful in data, specifically with Tableau, will tell you that there’s something else in this equation tying everything together. It’s not so much a specific technology as it is a way of doing things. It’s a process, a methodology, a mentality; hell, it’s a way of life. OK, that last point is admittedly a bit exaggerated, but my point is that it’s super important. What is this exactly? It’s formally known as Tableau Drive, and it’s a systematic methodology put forward by Tableau.
To sum it up, Drive is founded on success stories and best practices from case studies, the secret council of Tableau Jedi and the user community from the world over. Its purpose? It serves as the roadmap to building a cohesive, effective and efficient Tableau Center of Excellence, which is crucial to keeping your data analysis efforts on point.
That brings us here. In this series of articles, we’ll focus on the essential aspects of the Drive methodology as well as InterWorks’ unique take on Drive when serving clients in the real world. In Part 1, we’ll focus on agile BI and how it incorporates rapid prototyping from the software development world. Trust us, it’s more than just buzzwords.
Waterfalls vs. RAD
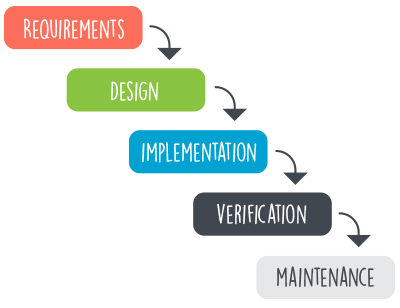
The old school approach to application development was known as the waterfall model. In this approach, development was divided into clear phases: requirements gathering, design, implementation, testing and maintenance. Each step leads to the next in a chronological order. Here’s this process illustrated:
While that model makes sense for other complex processes, like erecting a building, it creates complications with a more flexible and ambiguous process like designing an application. Perhaps the biggest criticism of the waterfall model is the quagmire that the requirements phase can become. It’s like falling into quicksand. Refining the exact needs and specifications of the software has killed many ambitious projects, almost always because business and IT just can’t seem to communicate effectively.
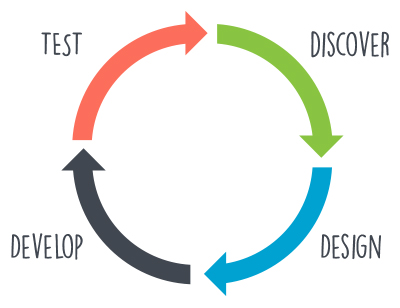
Rapid application prototyping (RAD) arose as an answer to this specific problem. This methodology isn’t a linear progression through a project. Rather, it’s a repeating cycle of sprints. Each of these sprints turn out an application prototype that is incrementally closer to the finished product. Here’s a pic for you visual peeps:
The entire idea behind rapid prototyping is to facilitate better communication between the end user and the development team. There are far too many times when a painful requirements process produces a half-assed application that has nothing in common with the original goal. And it’s not until you reach the Verification stage that you realize it was all a massive waste of time. Sounds pretty frustrating, right? It is.
Inversely, rapid prototyping engages the end user by giving them a clear view of what the application will look like and a hands-on feel for how it will operate. There are too many other advantages of rapid application development for everything to be covered here. Long story short, the end results are more satisfactory, progress is apparent to the entire organization and the development cycle is way faster, thereby being more cost effective.
Awesome. We now know that RAD is indeed rad and much better than the waterfall model for application development purposes. RAD is only the start, though. To keep things moving even faster, we need a seamless way for people to answer questions about their data in near real time.
Enter Agile BI
Agile business intelligence is a new phenomenon that emerged with the arrival of Tableau Software. It represents the three different areas in which Tableau has revolutionized the business world.
First, Tableau’s inherent capability to answer complex business questions has changed the way many companies make data-driven decisions down to the core. It used to take ages and a stack of lengthy, indecipherable reports to glean even the slightest insight from data, let alone apply it to a business decision. Now, using Tableau, a working prototype can be created in a week or even an afternoon, giving you a wealth of insights in a beautiful dashboard.
Second, Tableau introduced the concept of self-service analytics. The ease of the user interface and the drag-and-drop approach to report creation has given the end user the ability to create and manage their own reports. Best of all, they don’t need exhaustive knowledge of data practices and principles to do so. Tableau is so straightforward, that literally a child can use it. No joke. This data empowerment has understandably been a big hit amongst business folks, bringing a whole new demographic of people along with their unique perspectives.
And lastly, the power of Tableau Software means that there is a form of data rediscovery occurring within organizations as they reclaim their terabytes of dark data. All of that information from POS, social media, the internet at large and more is now at their fingertips. All it takes is a little Tableau magic to turn that data into value.
With all of those factors in mind, the draw of agile BI is pretty apparent. Tableau has knocked down the barriers that pervade traditional BI tools, making them look miserable in comparison (because they are).
This Is How We Do It: The Two-Week Sprint
Cue some Montell Jordan, it’s time to talk about how InterWorks does agile development. It’s actually pretty simple. We run a two-week sprint, starting with the Discover phase and transitioning quickly through the Design, Develop and Test phases. The goal is to create close collaboration with our clients so that at no point during the process are they disconnected from the process. We want to make sure everyone’s on the same page.
Each phase is similar in purpose to the traditional waterfall approach, but rather than focusing on finality of each phase, InterWorks’ business intelligence consultants gather as much information as needed to hit the ground running. Here’s how we break it down for each phase:
- Discovery: This phase starts with reviewing current capabilities within existing infrastructure and existing reports. In addition to gathering the requirements for the needed reports, our consultants also ensure that performance standards are in place for Tableau dashboards. When repeating the RAD cycle, we garner client feedback on the latest prototype to narrow and refine functionality goals.
- Design: Once we have an understanding of client infrastructure and goals, we start planning the best ways to reach those goals by looking directly at the data. This phase also includes mapping out processes for ETL, preparation of data extracts and the deployment environments.
- Development: The team works to quickly build working prototypes or to refine a given prototype, with each iteration moving closer towards the final goals of the client. All of the preparation required at the data-level in the Design phase is implanted in the Development phase, as well.
- Test: The final phase of the two-week sprint is to ensure that our prototypes meet performance standards for efficiency and speed as well as to identify how closely they meet the requirements defined in the Discovery phase.
In our experience, we’ve found that this take on agile development is the best way to navigate from the very start of the project to the finish. Two-weeks seems like a short time to get an entirely new process in place, but believe us when we say that it’s really not that complicated, especially when you have an experienced partner like InterWorks helping you out.
Next Steps
If you’re looking to implement the Tableau Drive methodology into your data analytics team, you can start by getting your report creators, your IT team and your data administrators very familiar with agile development. Find the time frame that works best for you and your team, but keep in mind this is rapid prototyping. Breaking away from the old Waterfall model can be daunting, but it’s so worth it.
Of course, you don’t have to go it alone. At InterWorks, we’ve helped countless organizations implement agile development as part of Tableau Drive. No matter where you’re at in your data journey, we provide the full-spectrum expertise to get you on track. Simply drop us a line, and we’ll get back to you ASAP.
Stay Tuned for More on Tableau Drive
Agile development is only part of the Tableau Drive methodology. The good news is that we’ll be covering all the other major components of Drive in this ongoing blog series. Be sure to check the Tableau Driver’s Ed channel regularly for more posts in the series.