
Please note that Portals for Tableau are now officially known as Curator by InterWorks. You can learn more at the official Curator website.
This blog post is Human-Centered Content: Written by humans for humans.
It’s one of the most common questions I get after a go-live. Here’s a practical look at your options — from Curator’s built-in tools to web analytics integrations and your BI platform’s own usage data.
One of the most common questions I get after a Curator go-live is some version of: “Can we track who’s actually using the portal?” Sometimes it comes from a BI manager trying to report on adoption. Sometimes it’s a stakeholder asking whether the investment is paying off. Either way, it’s a great question — and there are a few solid options depending on how much detail you need.
Here’s a practical breakdown of what’s available and how to get started.
What You’re Trying to Answer
Before jumping into setup, it helps to get clear on the questions you’re actually trying to answer. Most teams care about some combination of these:
- Are users logging in regularly, or just at launch?
- Which reports are being used, and which ones aren’t?
- Is a particular team or group disengaged?
- Did adoption go up after a navigation redesign or training session?
- Where are users dropping off?
Each of those questions points to a different data source, so knowing what you care about helps you decide how much to set up.
Three Ways to Track Usage in Curator
1. Curator’s built-in event log
The event log lives in the Curator backend under Settings › Event Log. It captures authentication events, integration calls, errors, and system activity — so it’s most useful for diagnosing access issues (like a user who can’t log in) rather than tracking behavior patterns. You’ll also find the Curator Digest here, which you can configure to send alert emails when new issues are detected or on a scheduled cadence for regular health summaries.
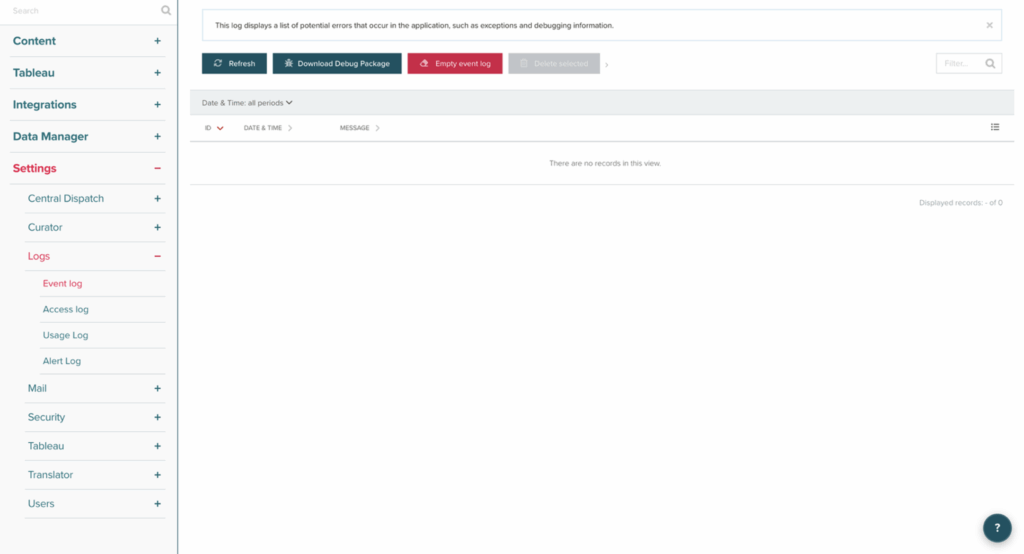
Above: The Event Log in the Curator backend, showing authentication and system activity.
Think of this layer as operational awareness, not adoption tracking. It’s the right first place to look when something is broken, but it won’t tell you whether your finance team is actually using the portal. This data is also available in a database table behind Curator for ingestion into reporting tools if desired.
2. Web analytics — Google Analytics or Matomo
This is the layer that gives you real behavior data. Curator supports web analytics integrations that let you capture page views, session duration, navigation paths and filter interactions.
For most organizations, GA4 is the easiest starting point. For teams with stricter data residency or privacy requirements, Matomo is worth considering since it can be self-hosted and keeps all data within your own infrastructure.
Both are configured in the same place: Settings › Curator › Portal Settings › Analytics tab. Curator has dedicated fields for each option — no custom code injection required.
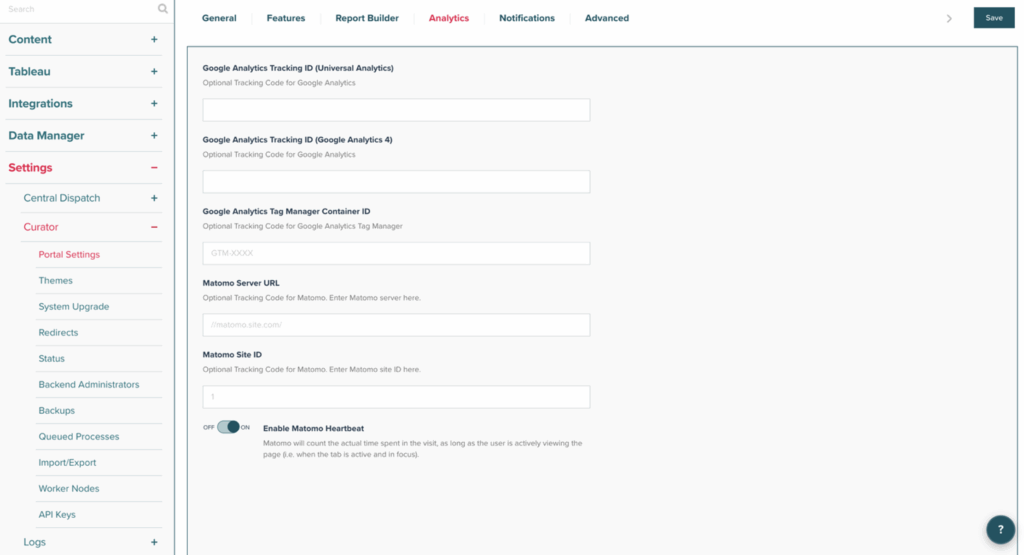
Above: The Analytics tab in Portal Settings, showing fields for GA4, Google Tag Manager and Matomo.
For GA4, the setup is straightforward:
- Create a GA4 property in Google Analytics for your Curator portal.
- Copy your Measurement ID — it looks like G-XXXXXXXXXX.
- In the Analytics tab, paste it into the “Google Analytics Tracking ID (Google Analytics 4)” field and save.
- Visit the portal frontend and confirm events are showing up in GA4’s real-time view.
If you’re using Google Tag Manager instead, there’s a separate Tag Manager Container ID field (format: GTM-XXXX) that handles that workflow.
For Matomo, enter your Matomo Server URL and Matomo Site ID in the corresponding fields. There’s also a Matomo Heartbeat toggle — enabling this tells Matomo to track actual time-on-page rather than just page loads, which gives you a much more accurate picture of engagement. Worth turning on.
3. Your BI platform’s own usage data
Curator sits in front of your dashboards, but Tableau and Power BI both record their own view-level usage data. Pairing that with Curator-level data is where the picture gets really useful.
On Tableau Server or Tableau Cloud, usage data is available through the built-in admin views, the PostgreSQL repository (on Server), or the REST API. If users are authenticated through Curator and passed through to Tableau with their actual identity, those view counts map to real people — which means you can correlate Curator page visits with actual dashboard engagement.
On Power BI, the Activity Log and Admin API expose report and workspace-level activity that you can query programmatically.
The combination is powerful: Curator tells you someone visited a page; the BI platform tells you whether they actually interacted with the dashboard once they got there. A page with solid traffic but low Tableau engagement usually means a load time issue, irrelevant content, or a navigation mismatch worth investigating.
Quick-Start Checklist
- Enable Curator Digest — “Immediate” for issue alerts, “Scheduled” for regular health summaries
- Choose a web analytics platform — GA4 for most orgs, Matomo if self-hosted is a requirement
- Enter your tracking ID(s) in Settings › Curator › Portal Settings › Analytics tab
- Verify tracking is firing using GA4 real-time view or Matomo’s live tracker
- Connect your BI platform’s usage data — Tableau admin views or Power BI Activity Log
None of this has to be complicated to be useful. Even basic web analytics gives you enough signal to make smarter decisions about your portal and tell a better story about adoption. If you’re running Curator today without any tracking in place, this is a good time to change that.
If you have questions about setup or want help deciding which approach makes sense for your environment, feel free to reach out to your InterWorks TAM or send us a note at curator@interworks.com.