
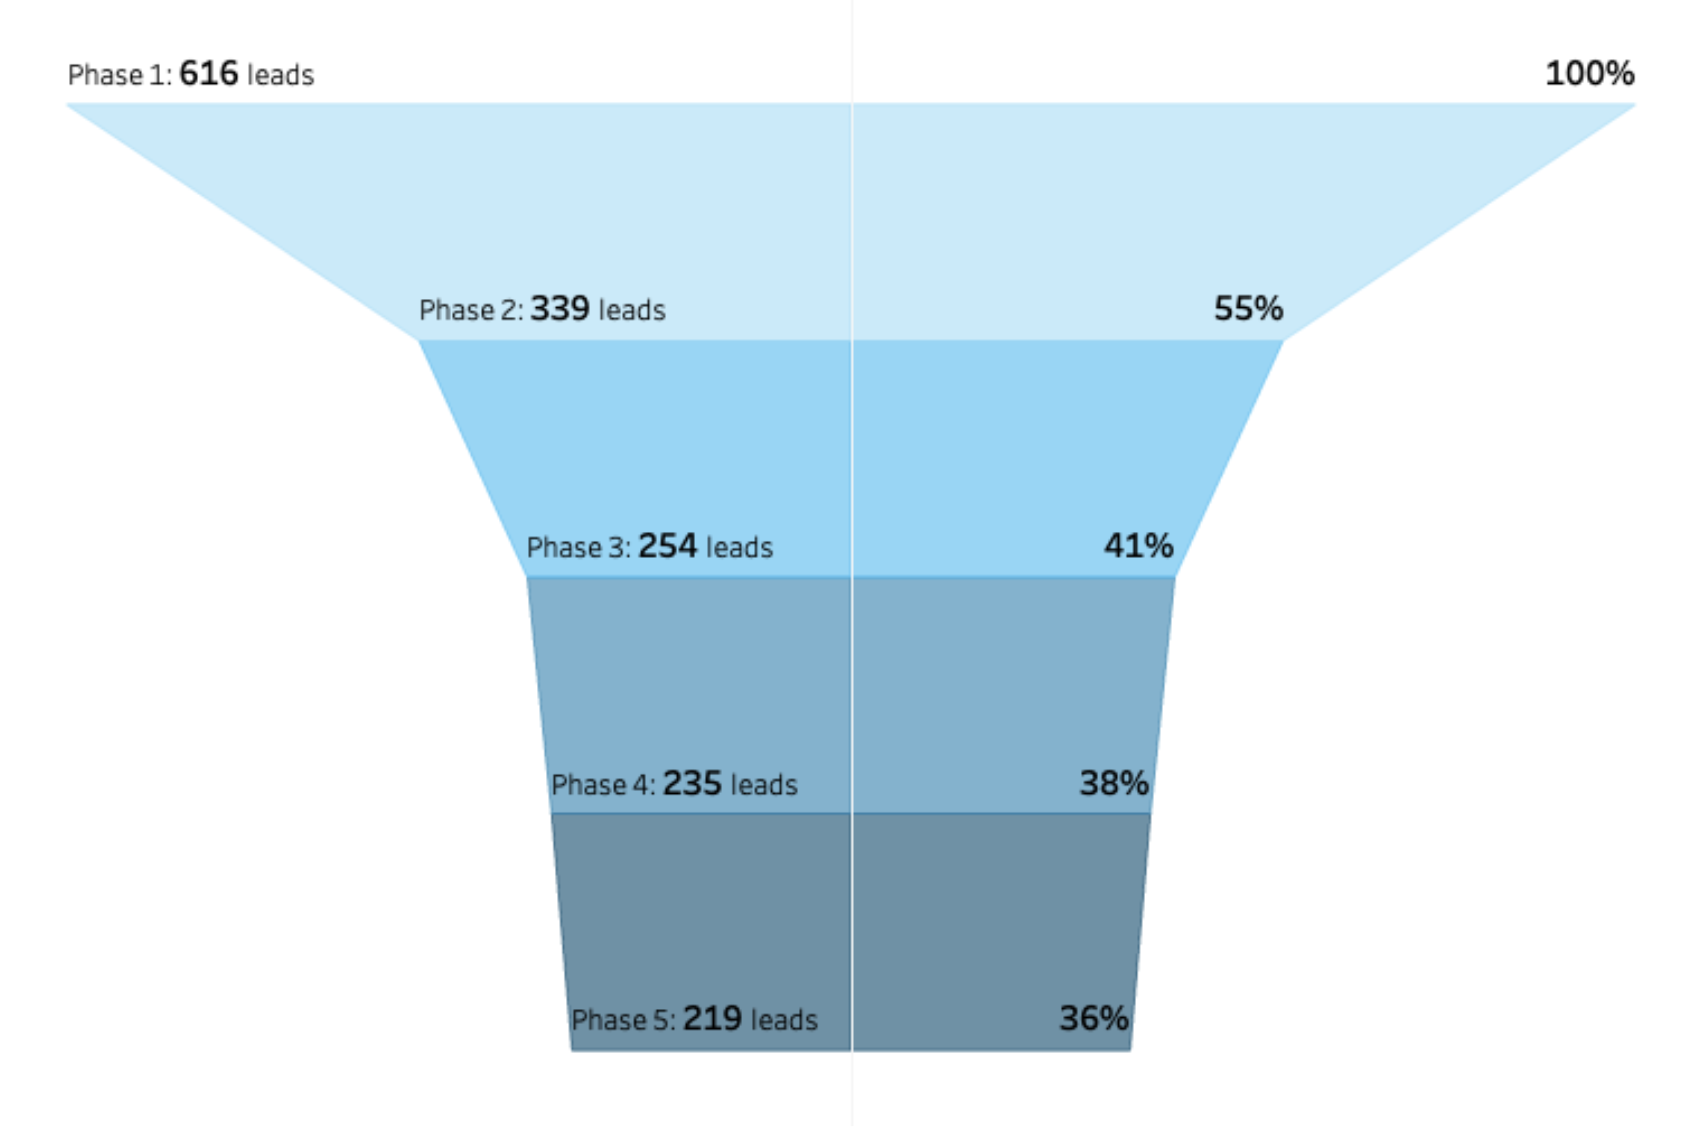
As we’ve published before, a funnel is a great way to represent and track a flow or stages in a process. Whether in business, science or engineering, for instance, we can use funnels to easily see and analyze how large or small those stages are, or, in other words, how many elements are reaching each certain point. We can talk about conversion rates (how many elements are we able to transform from one phase to the next one) or find out if there are any sort of bottlenecks within our process:
On past articles, we’ve shared how to build several types of funnels: a stepped funnel, a smooth funnel and a shape funnel. Now we are upgrading them by building a more complex version: a colored smooth funnel.
A funnel whose sections have all individual colors and whose dimensions of those sections are in total proportion to the amount of elements. We will add not only the number of elements to each section, but also the percentage they represent respect to the initial phase. In other words, the conversion rate. Each one of these steps requires tools, like table calculations and level of detail calculations (LODs). Haven’t you worked with LODs before? No problem! We have a great guide for you here.
These steps might not seem that simple or intuitive, but don’t you worry. We’ll guide through the whole process.
The Data Set
The steps shown in this post use a generic set of data with very few fields. We require:
- A field that identifies the elements that we are counting. It could be accounts, clients, projects, products or subjects, but in this case, we’ll call them leads, and the field itself, Lead ID.
- A field that identifies and assigns ordinality (we’ll go back to this term) to the phase where the element or lead is (or where it has been). This means this field must to be an integer. In this case, Phase ID.
About this second field, consider two aspects:
First, ordinality means order. This field should tell us in which order the phases occur. Second, the section in parentheses is optional. We’ll see that we can build this funnel using the phases where every element has actually been, or we can build it only using its current phase and assume that that element has been on all previous phases in order to get there. This means, we’ll be able to build this funnel whether your data has the history of all phases where an element has been, or even if your data only has the current or latest phase of every element.
All other fields, like name of the phases, dates or other measures are nice-to-haves, but not required, other than the first two mentioned.
Now let’s dive into the actual building!
The Calculated Fields
We will need several calculated fields. To be precise, three by every phase of our process.
1. The first type of field will retrieve the number of elements per phase:
{ EXCLUDE [Phase ID] :
COUNTD( IF [Phase ID] >= N AND [Phase ID] < N_max THEN [Lead ID] END )}
Where N is the phase, whose elements we are counting, and N_max is the last phase; in case the last phase is something similar to close lost or unsuccessful.
The logic of this field is as follows:
- We want to count all leads in a particular phase. Hence the first condition after IF.
- We also want to include elements in next phases that might have skipped a particular phase, but exclude those in the last phase, as they are unsuccessful. Hence the second condition after AND.
- And we need the result to appear in the chart, no matter which phase we are plotting. Hence the function EXCLUDE.
- We will name this field Phase N Leads. Changing the N to the actual number of the phase.
- In case we just want to count the elements that are actually in the phase, the field can be simplified as:
{ EXCLUDE [Phase ID] : COUNTD( IF [Phase ID] = n THEN [Lead ID] END )}
2. The second type of field will let us plot the result of the first calculated field in the actual funnel:
IF ATTR( [Phase ID]) = N THEN SUM( [Phase N Leads])
ELSEIF LOOKUP(ATTR([Phase ID]),1) = N THEN SUM( [Phase N-1 Leads])
END
Where, again, N is the phase of the field we’re building, and N-1, the previous one.
About this second field:
- It contains a table calculation within it.
- It retrieves two results: the number of elements of the current phase and the elements of the previous one. That’s how we get the polygon shape for every phase in the funnel.
- Consider that, since we have the term N-1, we build this field only for the second phase onwards. The first phase doesn’t require one.
- We can add this field to the label mark to be able to read the actual value.
- We will name this field Phase N.1, as N represents the corresponding phase.
3. The third type of field is very similar to the second one and you must build it, only if you want to also show the percentages each phase represent respect to the initial one, i.e. the conversion rates. If not, you can dismiss it.
IF ATTR( [Phase ID]) = N THEN
SUM( [Phase N Leads]) / SUM( [Phase 1 Leads])
ELSEIF LOOKUP(ATTR([Phase ID]),1) = N THEN
SUM( [Phase N-1 Leads]) / SUM( [Phase 1 Leads])
END
Remember that in this field, we compare every phase to the first one to get the desired percentage. It can also be added to the label mark. We will name this field Phase N.2, as N represents the corresponding phase.
Don’t forget to add the corresponding default format to each field (whole number and percentage). This will save you some minutes when building the actual funnel. And remember to repeat the calculation for every phase, simply by duplicating the first of each one and changing the fields inside.
The Actual Building of the Funnel 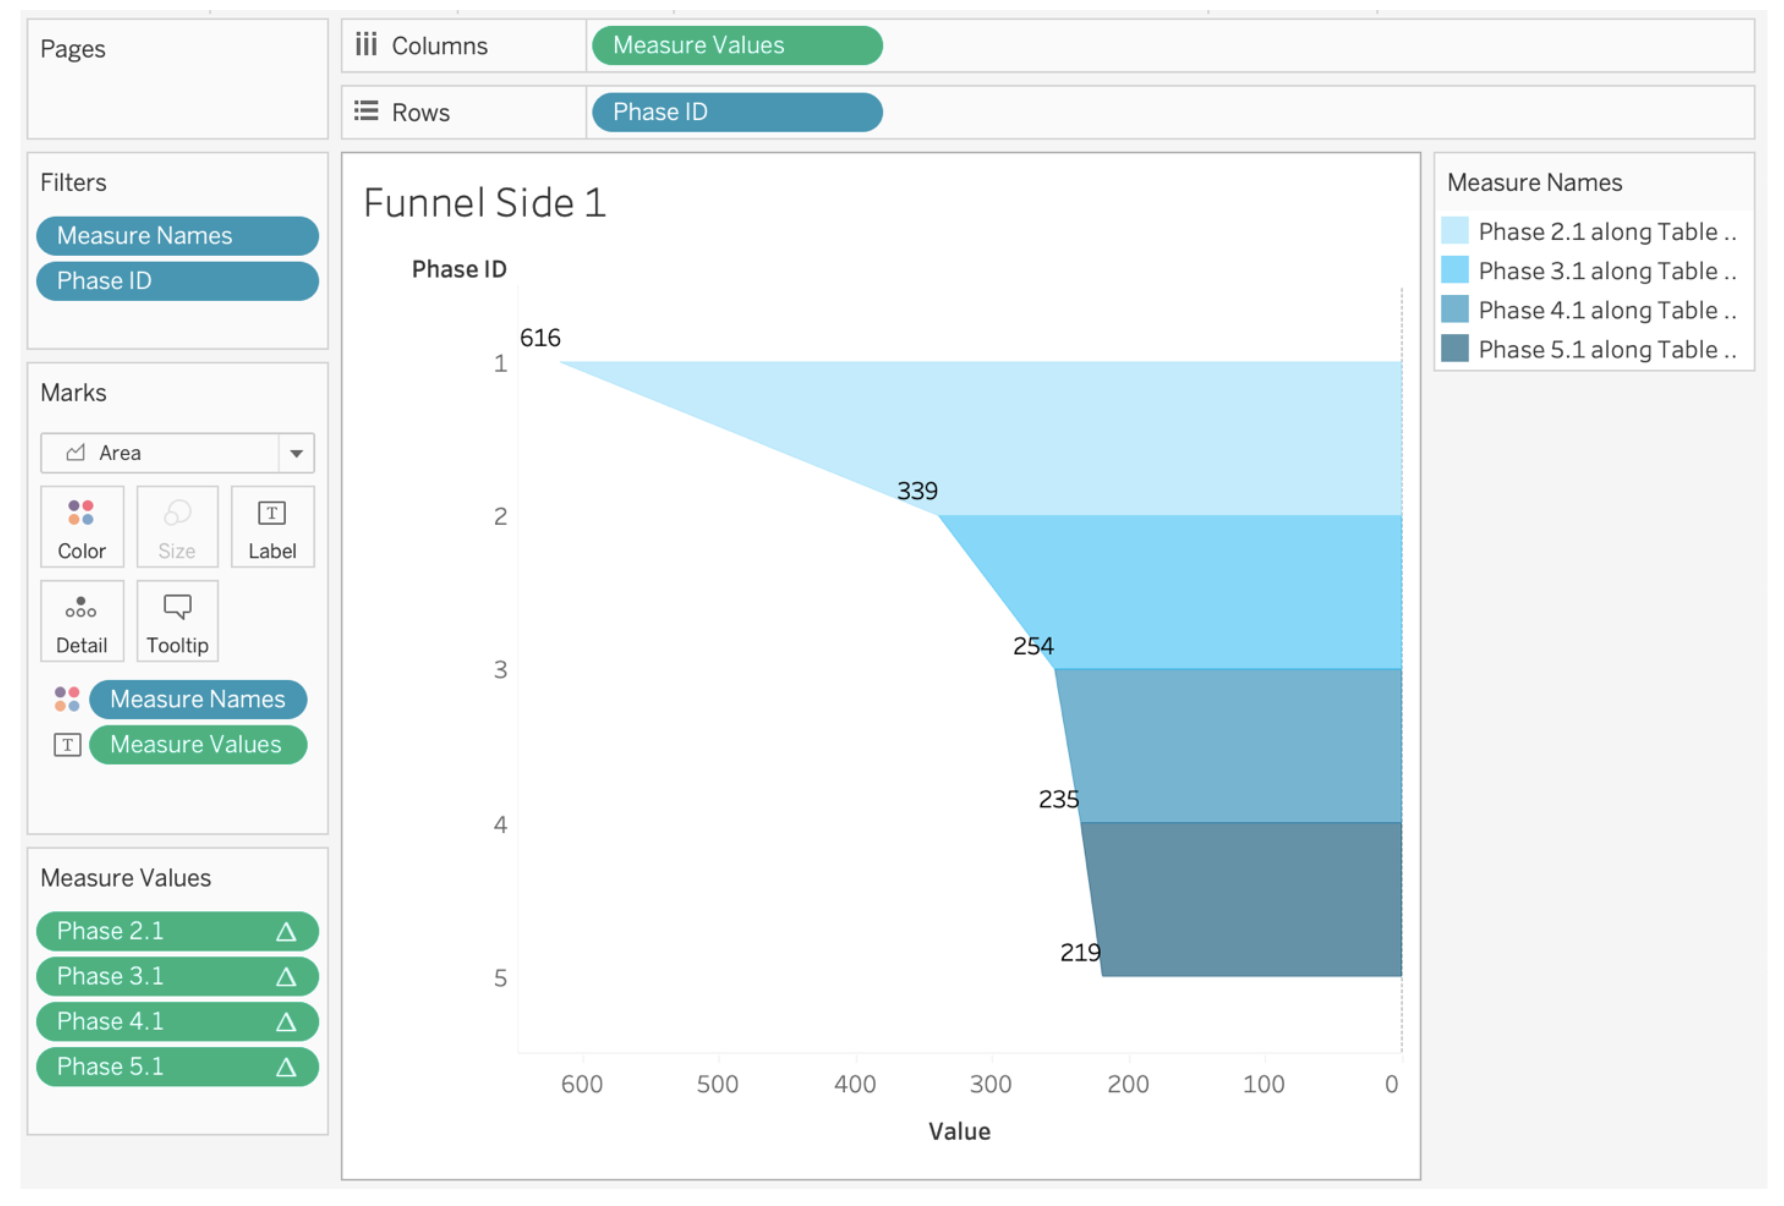
- Use the image above as a guide. We’ll start by adding in a new sheet the following:
- Phase ID into Rows.
- Measure Values in Columns, with the values of the second set of fields we created (Phase N.1) as measure values.
- Measure Values also in the label mark.
- Measure Names in filters, as usual.
- Measure Names also in the color mark, so we can assign a different color to each phase.
- Next, we’ll need to change the scope and direction of our calculated fields in Measure Values to be Table (down) (remember that they are table calculation actually).
- You will get double values in the labels. Make them overlap by aligning them equally instead of automatically so that they appear to be just one value per phase.
- If you want this section to be the right-hand side of the funnel, duplicate it, and after that, invert the axis, so that it goes from right to left.
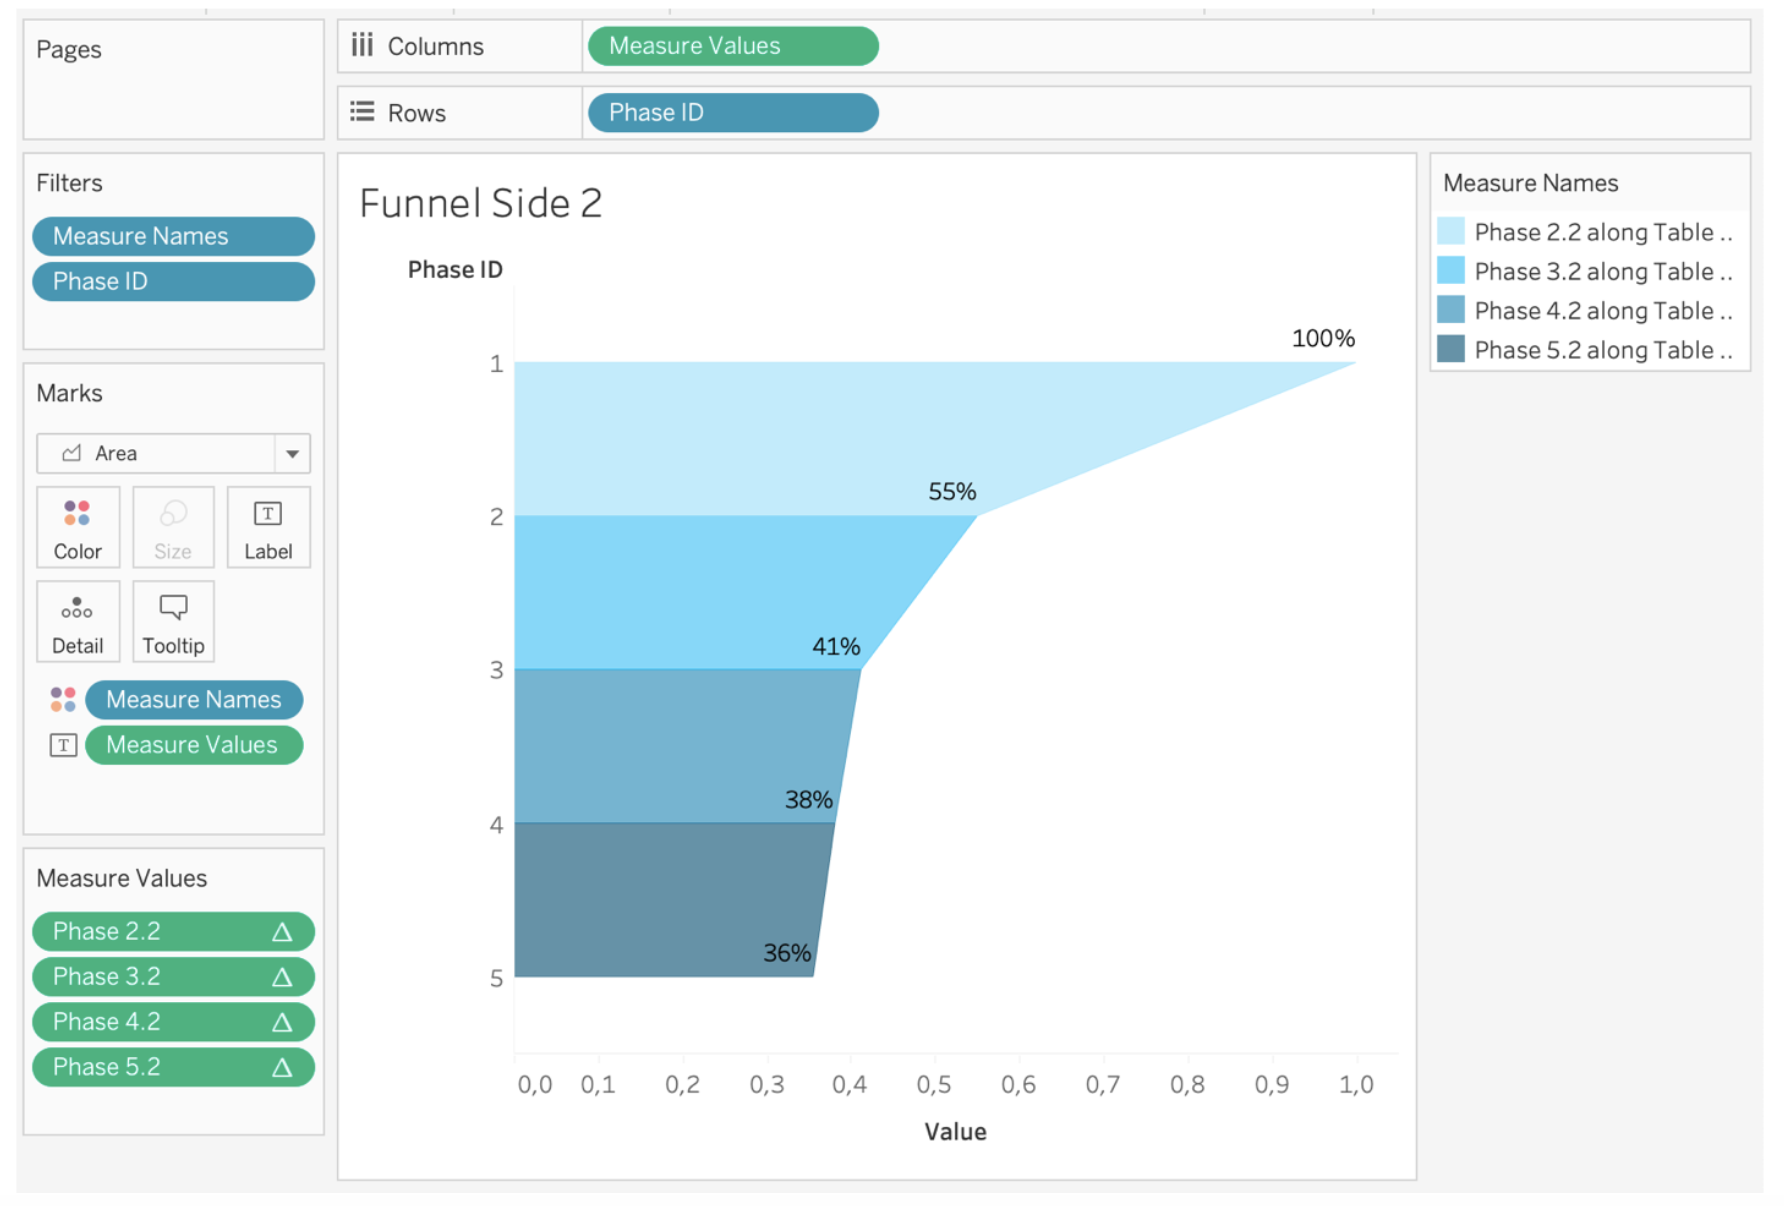
- Continue with the duplicate sheet and replace the fields in Measure Values with the third set of fields we created (Phase N.2). The ones that contain the percentage values.
- Repeat the process to change their scope and direction to Table (down).
- You should get a shape identical as the previous sheet, but this time the axis has values only from 0 to 1.
- Align the color, so that they match the previous chart, and add the values to the label:
- Combine the two sheets in a dashboard to build the complete funnel.
- Add the phases to the labels and hide them as headers, hide the axis, edit the aliases of the legend, hide the zero line of each chart and customize everything accordingly:
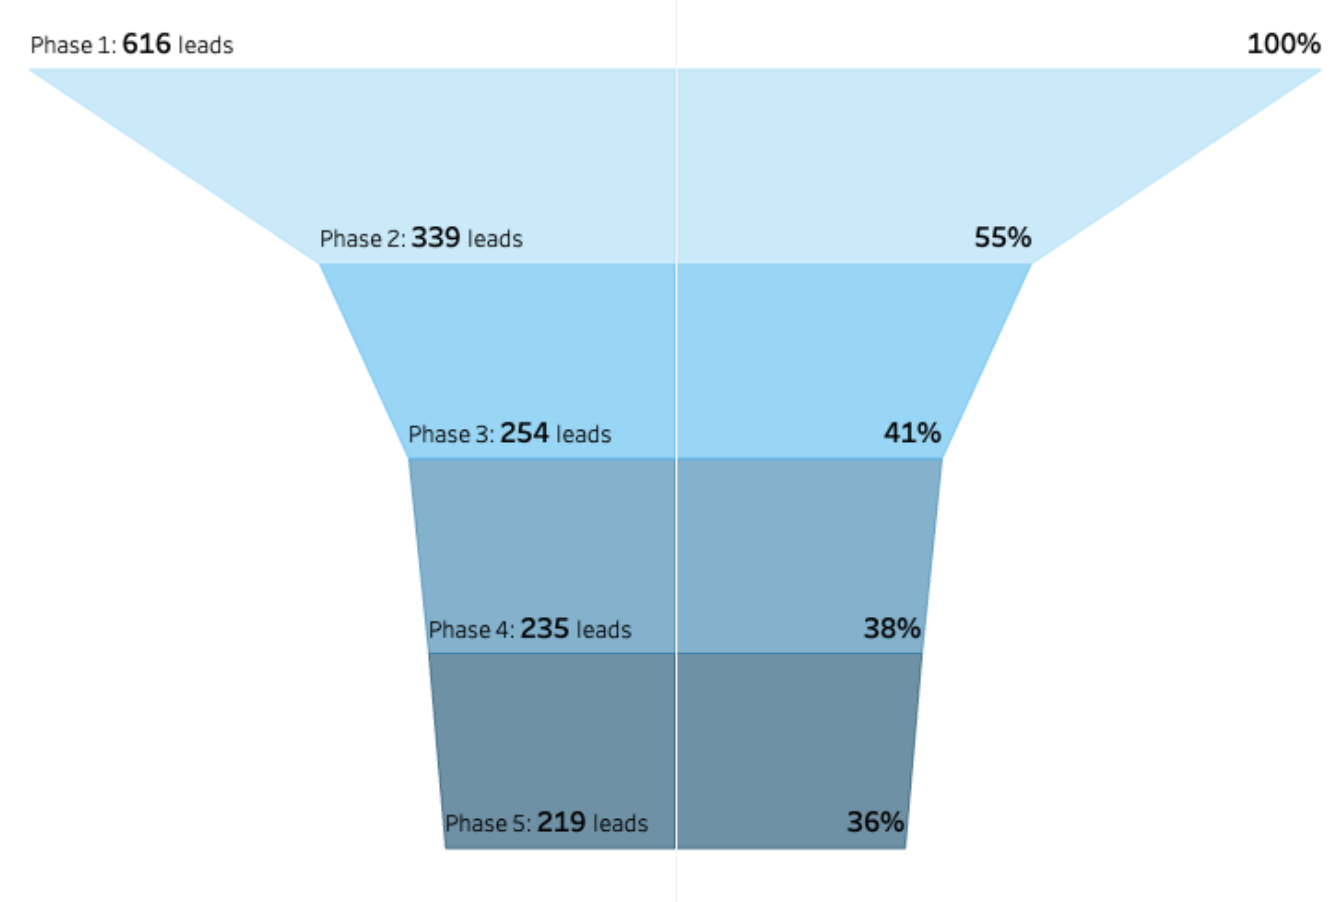
There you go! A smooth funnel with a color for every phase that shows both the number of elements and their share compared to the initial point. If you want help implementing this for your dashboards, feel free to reach out and see what we can do for you.