Often in my training classes, I find students who are building dashboards to monitor a linear workflow such as an HR recruiting pipeline or order fulfillment. Tableau is an excellent BI tool to monitor these workflows, and a funnel chart is a powerful, easy-to-build visual that can provide valuable insight into your data.
Funnel charts are a great way to track progress through a workflow with multiple steps. They can highlight how well a process is being followed and easily identify any bottlenecks. You can even use table calculations to look at different ways to measure progress to each step (percent of total, percent change, etc.).
There are two easy to build funnel charts in Tableau: a Stepped Funnel Chart and a Smooth Funnel Chart.
Stepped Funnel Chart
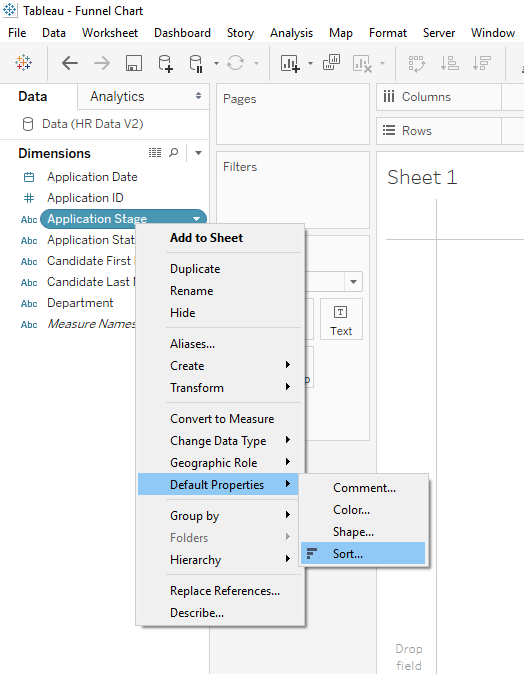
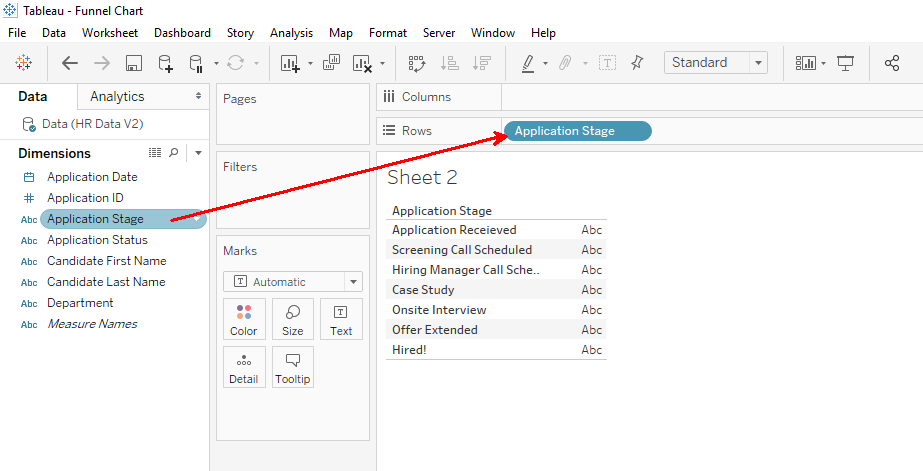
Step 1: Set the default sort order for the stages of your data (Tableau will default to alphabetical).
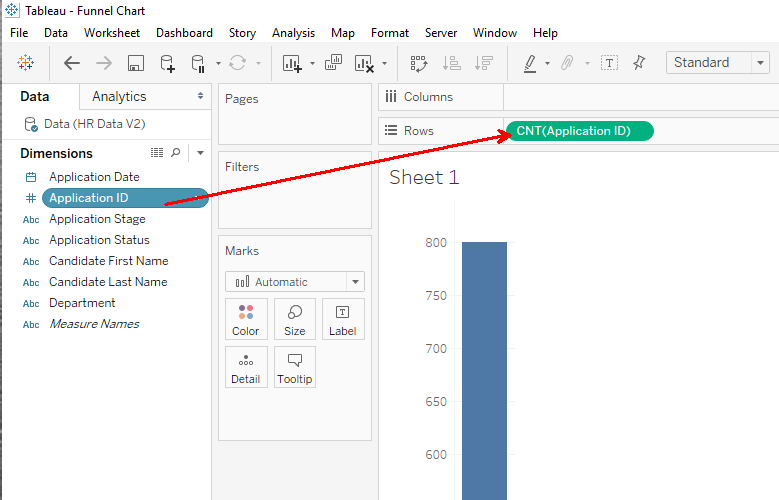
Step 2: Drag your record Count field on to the Rows shelf. This may be the Number of Records field provided by Tableau or an ID dimension field. Ensure the Count or Count Distinct aggregate function is selected.
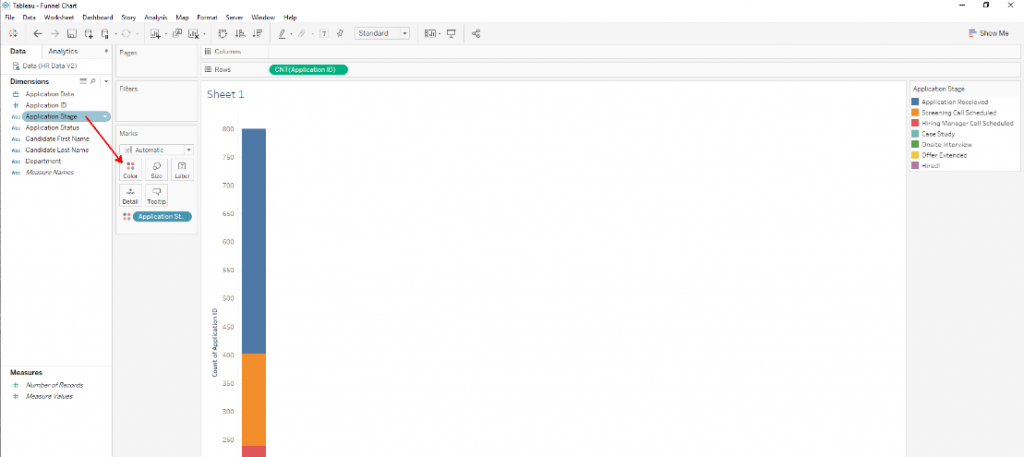
Step 3: Drag the Dimension pill, which includes your stages, onto Color.
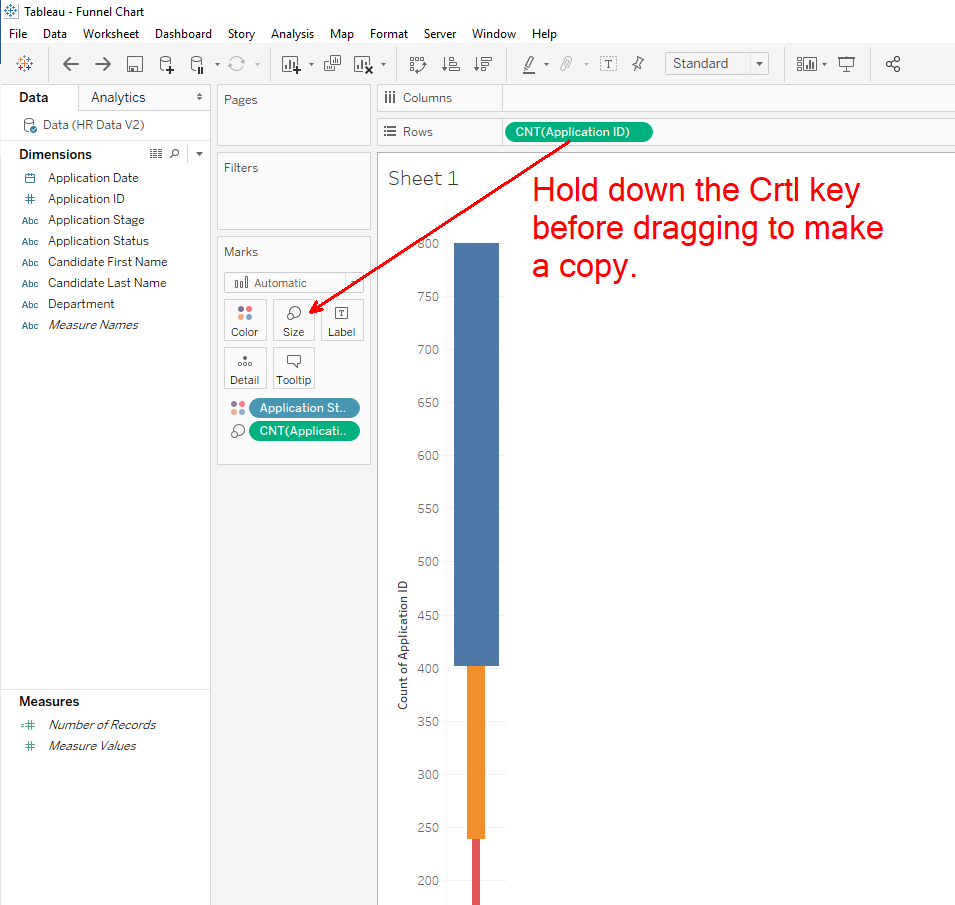
Step 4: Make a copy of your Count field and drag it from the Rows shelf onto the Size tile in the Marks card.
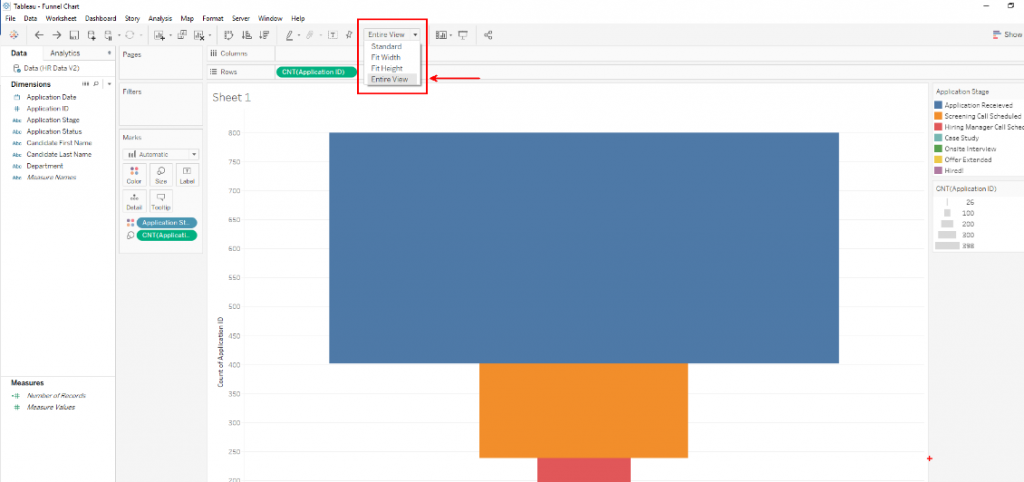
Step 5: Change the view fit from Standard to Entire View.
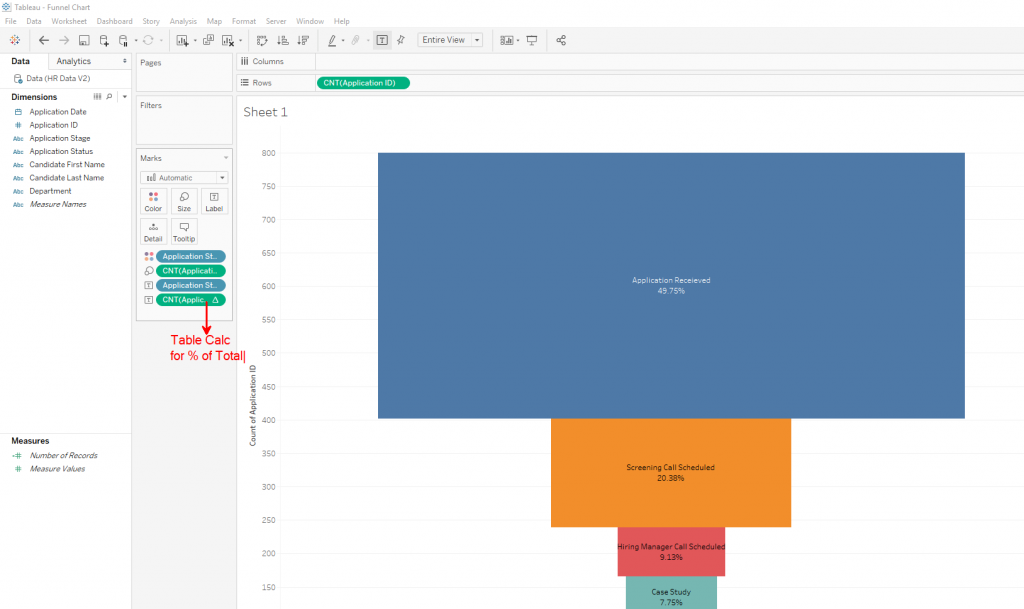
Step 6: Add labels and format the chart to your liking.
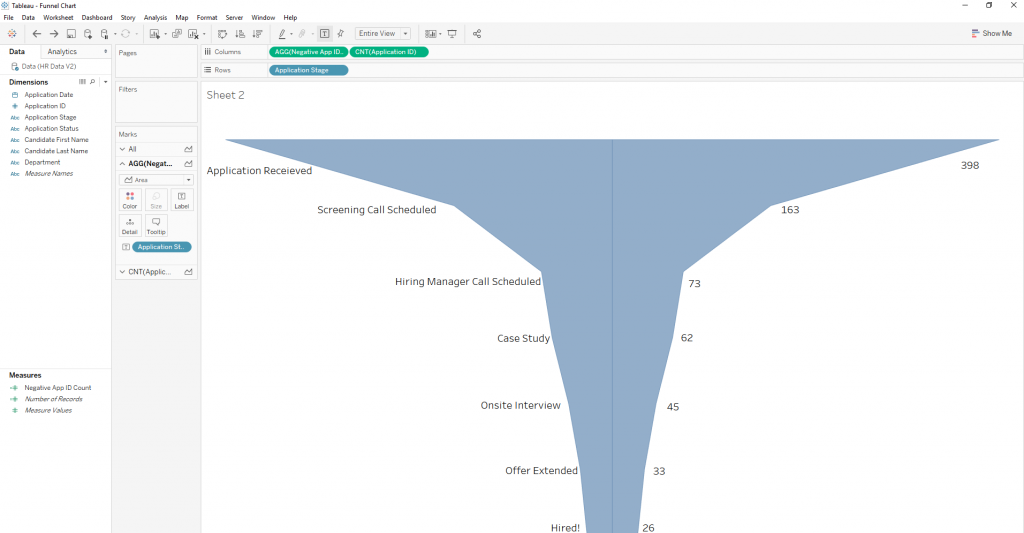
Smooth Funnel Chart
Step 1: Set the default sort order for the stages of your data (Tableau will default to alphabetical).
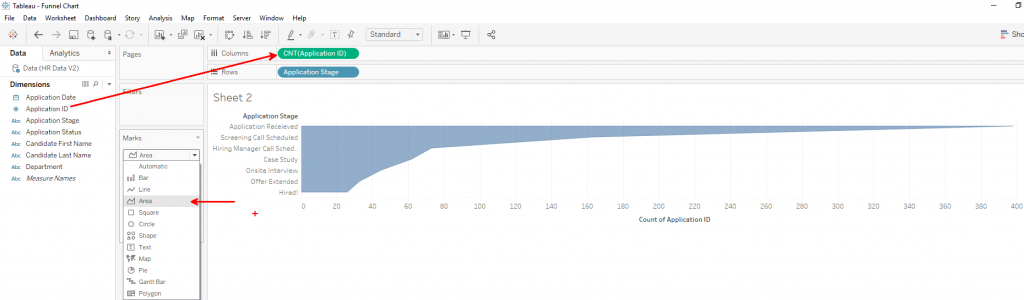
Step 2: Drag the Dimension pill, which includes your stages, onto the Rows shelf.
Step 3: Drag your Count field on to the Columns shelf and change the mark to Area Line.
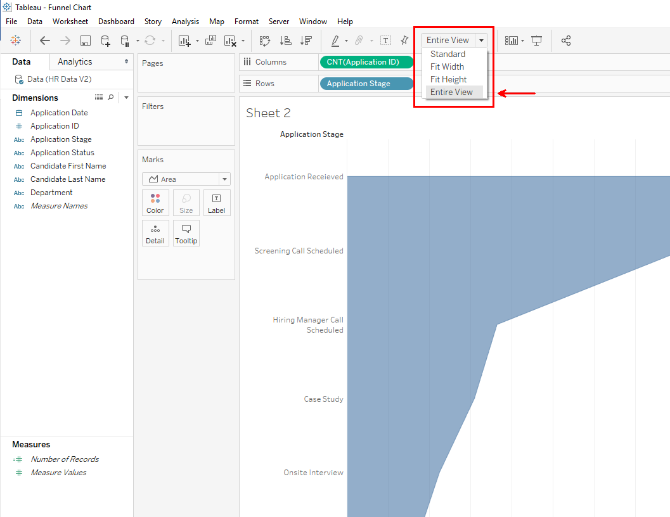
Step 4: Change the view fit from Standard to Entire View.
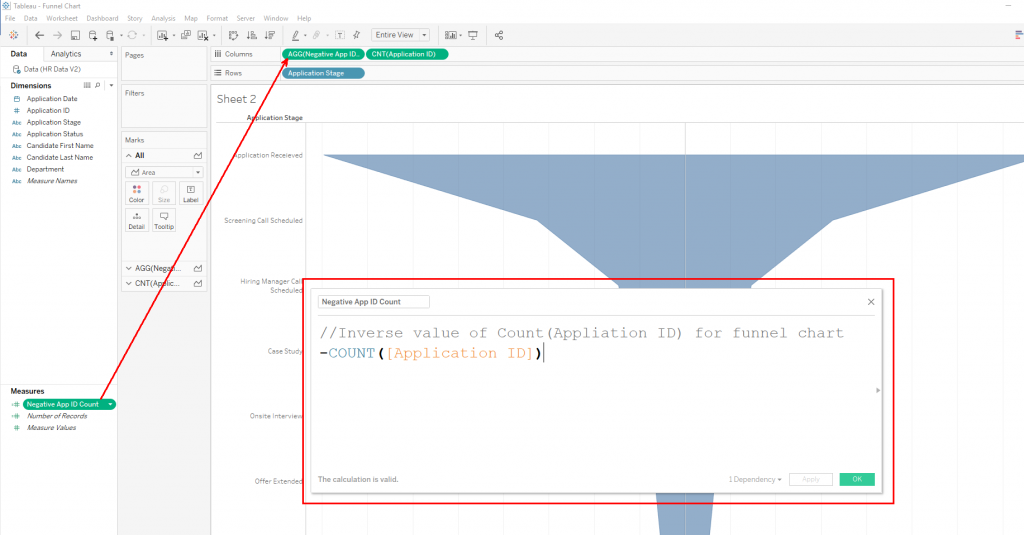
Step 5: Create a calculated field for the inverse value of your Count field and drag it onto the Columns shelf to the left of your original Count field.
Step 6: Add labels and format the chart to your liking.