
This post is going to be my first of a 3-part series called “Learn ThoughtSpot With Me.” As an Enablement Consultant, I teach technical things. What I’m most passionate about are data analysis, trends, and visual analytics. I hope you enjoy the series and look forward to hearing your comments.
Let’s get started.
Sharpen Your Pencils, Class
Have you ever wanted a search engine to run on top of your data? For example: you’ve wanted to type in a question, just as you might say it aloud, and get an immediate and meaningful response from your data table?
Or are you eager to make analytics available for everyone in your organization, but dread the process of defining all the different things you might have to do to make that happen?
What about this: Do you dream of a future where a data application gets to know you and your users’ habits, and is powerful enough to adjust automatically based on actual activity and usage over time?
Welcome ThoughtSpot to the discussion.
Business Intelligence 3.0 is here, and it’s all about self-service analytics. In previous eras, you began to compile visual reports of your data and were able to push that insight out to secure areas, whether on your own server or into the cloud, for others to perform actions on.
But self-service analytics up to this point hasn’t truly been about “self.” An end user would be given already published visualizations and dashboards to find meaningful data insights and trends from them.
That sounds simple enough, right?
Here’s the issue: It takes a lot of time and resources to develop charts and dashboards that serve every individual “end user’s” needs. On top of that, there’s quite a bit of pressure to achieve a pixel-perfect design when creating these objects and assets.
For some companies, the entire lifecycle of dashboard development – planning, designing, iterating, critiquing, updating, enhancing, fine-tuning, publishing and continuously changing – can feel futile.
And with lots of end users comes lots of things to look at and store and permission and monitor and refresh and govern and support.
For those organizations, tools like ThoughtSpot are a breath of fresh air.
ThoughtSpot promotes the ability for every employee within an organization to ask questions and get answers quickly from company data. After learning the tool and becoming a certified ThoughtSpot Professional recently, I’ve come up with my own little ThoughtSpot jingle that they may or may not approve of:
“Analytics to all. And to all a good night.”
I lifted that from Clement Clark Moore’s ’Twas the Night Before Christmas, if it happens to sound familiar. My point is that every day is Christmas with ThoughtSpot. You wake up, and there are new “data” gifts waiting for you to open and bring to life. You don’t have to wait for mom and dad to tell you it’s okay either. Just start tearing through the gift wrap when you’re ready.
My focus for this post is to help you understand a couple of the key features of ThoughtSpot, so when you get into the tool for the first time yourself, you’ll have some general awareness for navigating the pages and performing the most common actions, such as:
Searching and Sharing
ThoughtSpot enables you to view and analyze your data through a search-based user interface. You can create your searches quickly and easily, just by typing them into a search bar. ThoughtSpot also makes it easy to “see” your data, do quick analysis and get your questions answered through on-demand charts and interactive Liveboards at its core.
In ThoughtSpot, end users will be assigned roles and oftentimes put into groups to help define which overall capabilities and privileges that user might have. Here are a few of the most common:
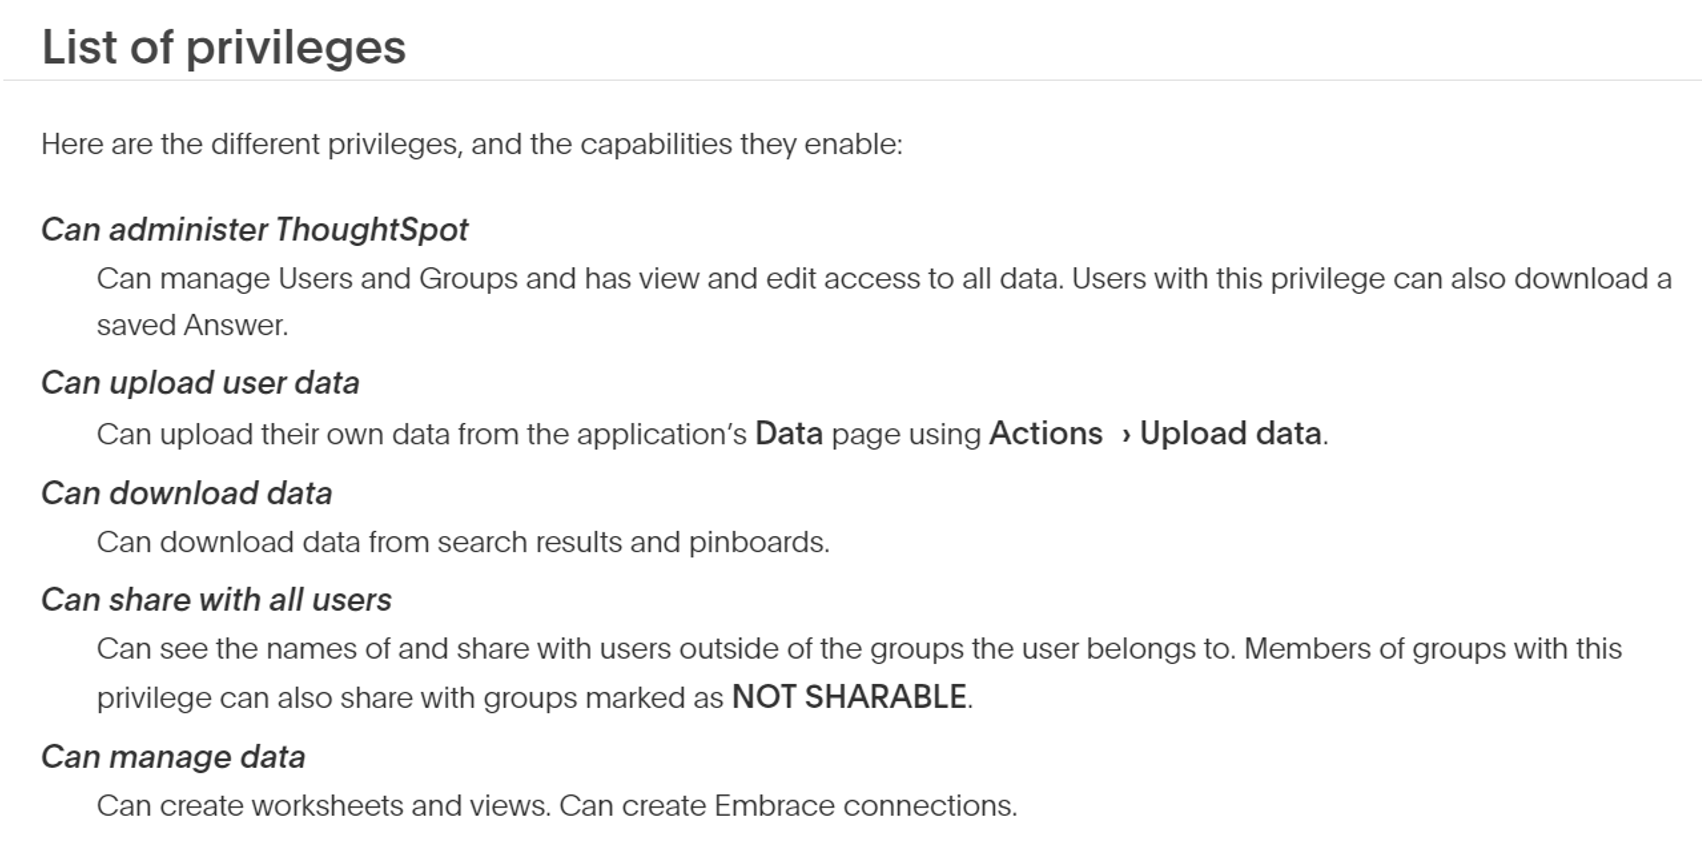
As an end user, who is able to manage data, I can create worksheets and views based on the data that has been shared with me. Data can come in the form of worksheets, views and answers inside of ThoughtSpot.
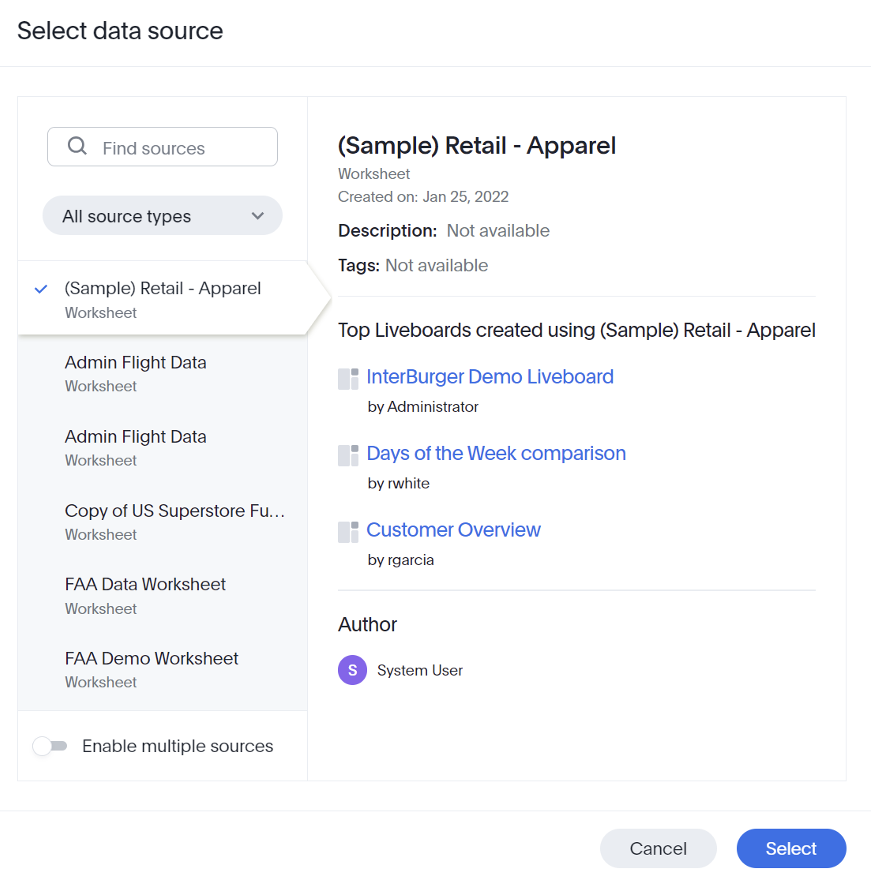
A worksheet is a list of fields that you can use to perform searches on, create answers with and are connected to your data warehouse directly, so you have the latest data available to visualize and share:
If a worksheet is shared with you, then you can run a “Search Data” function to type in combinations of measures, attributes, filters and keywords to uncover immediate insights in the form of sensible charts, graphs and tables:
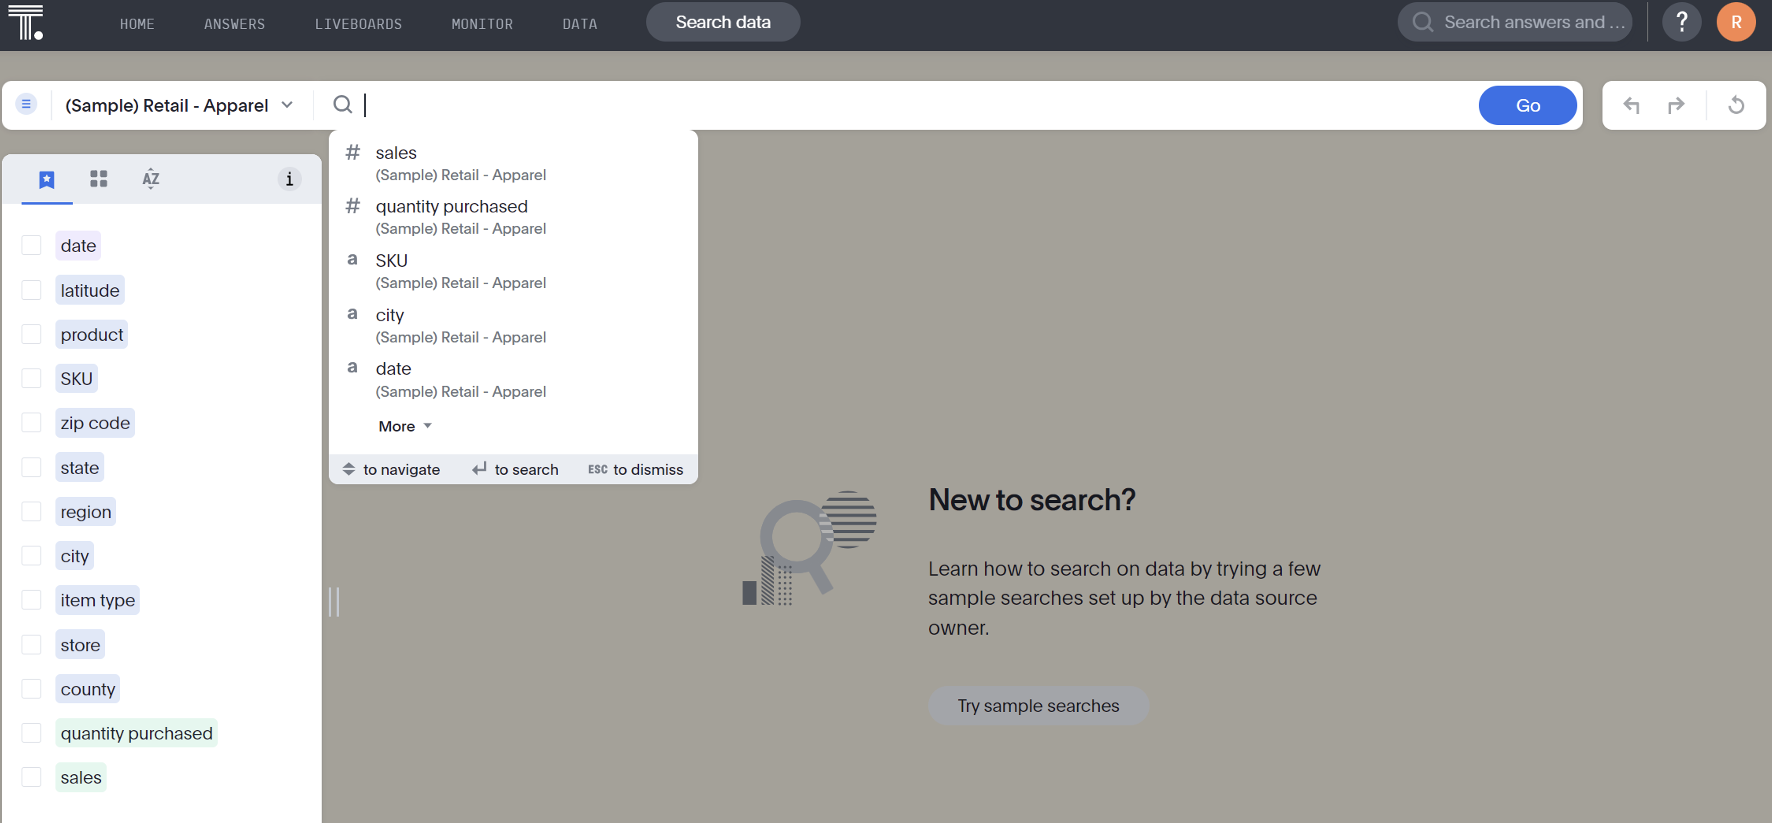
Measures are your numerical data that you may want summed, totaled, counted, etc. Attributes are your qualitative fields that help to breakdown your data or put them into buckets. Attributes are the owners of the bars, pie slices and lines in your most common charts.
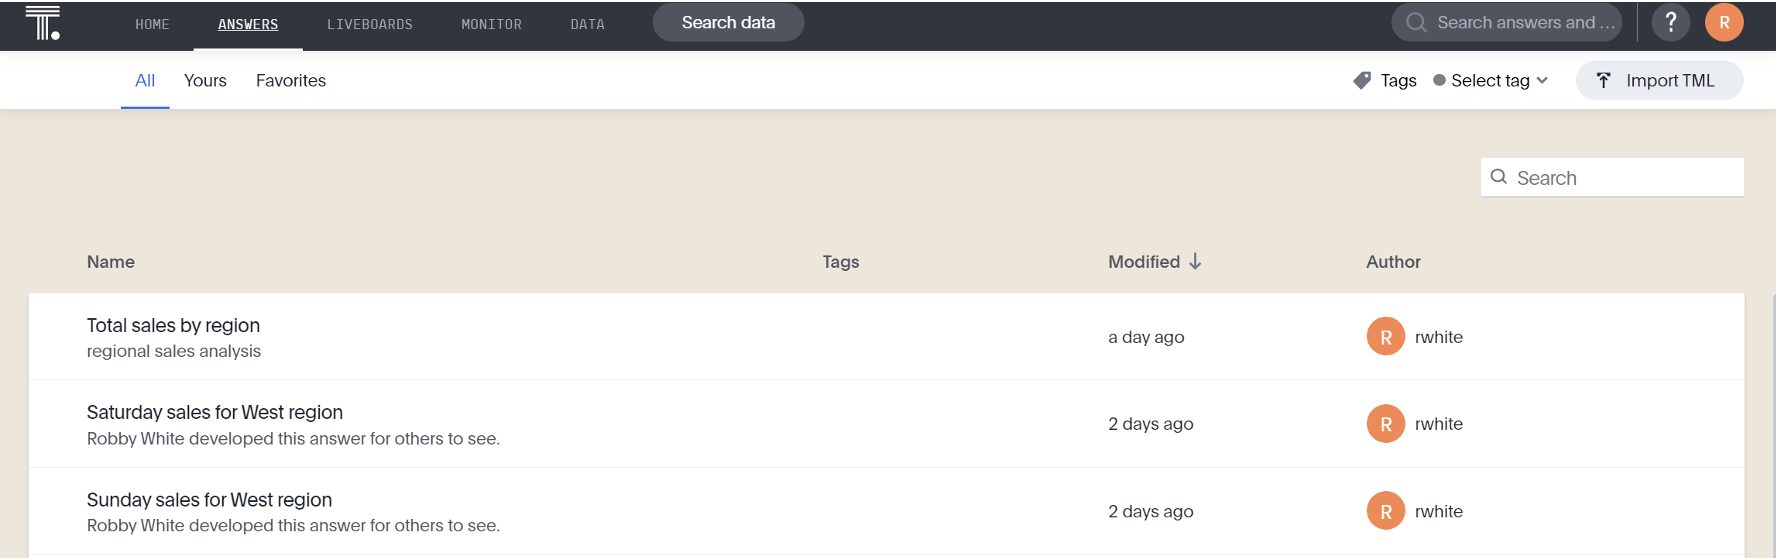
ThoughtSpot also has a search-engine like capacity to show answers and Liveboards based on natural human-spoken questions. As an end user, you wouldn’t see anything other than a promoted search bar at the top of your homepage. But don’t let its simplicity fool you, it’s going to bring relevant answers directly to your doorstep to save (or potentially to edit, format and share with others):
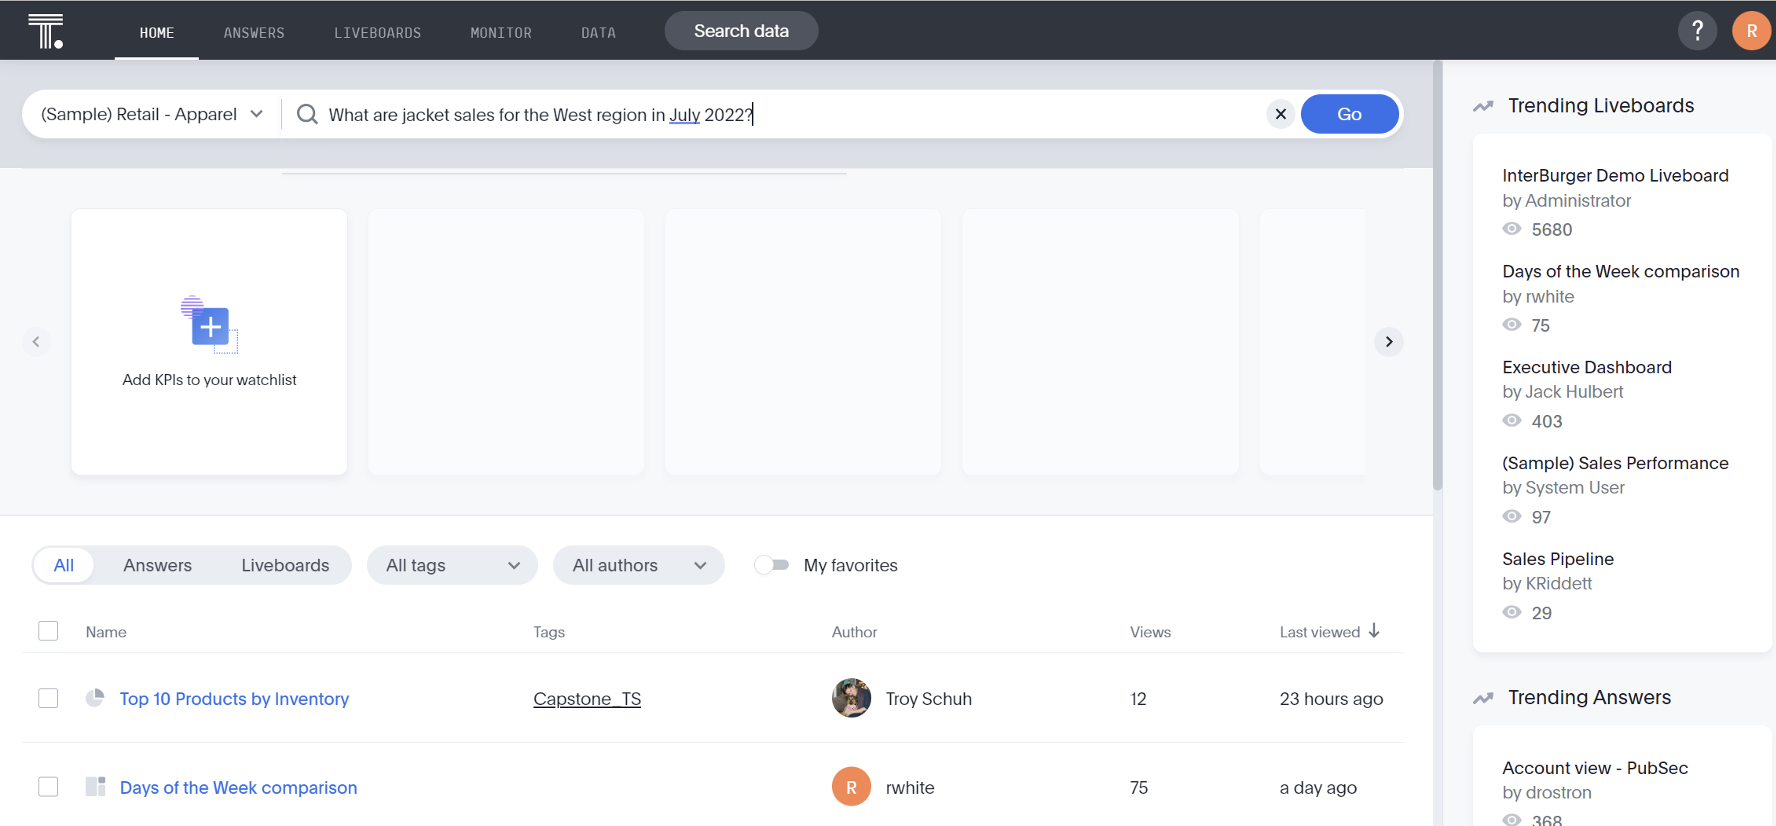
An answer in ThoughtSpot is simply a saved search. Answers are indexed and shown to others when they ask similar questions of your data. This saves on discovery time and storage, and saves others from recreating the wheel. If someone’s already asked something similar and the result was meaningful enough to save, then you become the beneficiary by simply selecting a saved response, springboarding you immediately into data discovery mode. I’ll oftentimes copy a saved answer that I can’t edit, if I want to use it as a source of inspiration:
A collection of shared answers can be put onto a Liveboard. Answers get pinned to Liveboards as they are being added and saved, and those answers can be filtered and drilled down further from within the dashboard interface for further analysis and insights. The best part is your data is “live” and 100% up to date since you’re connected directly to your data warehouse:
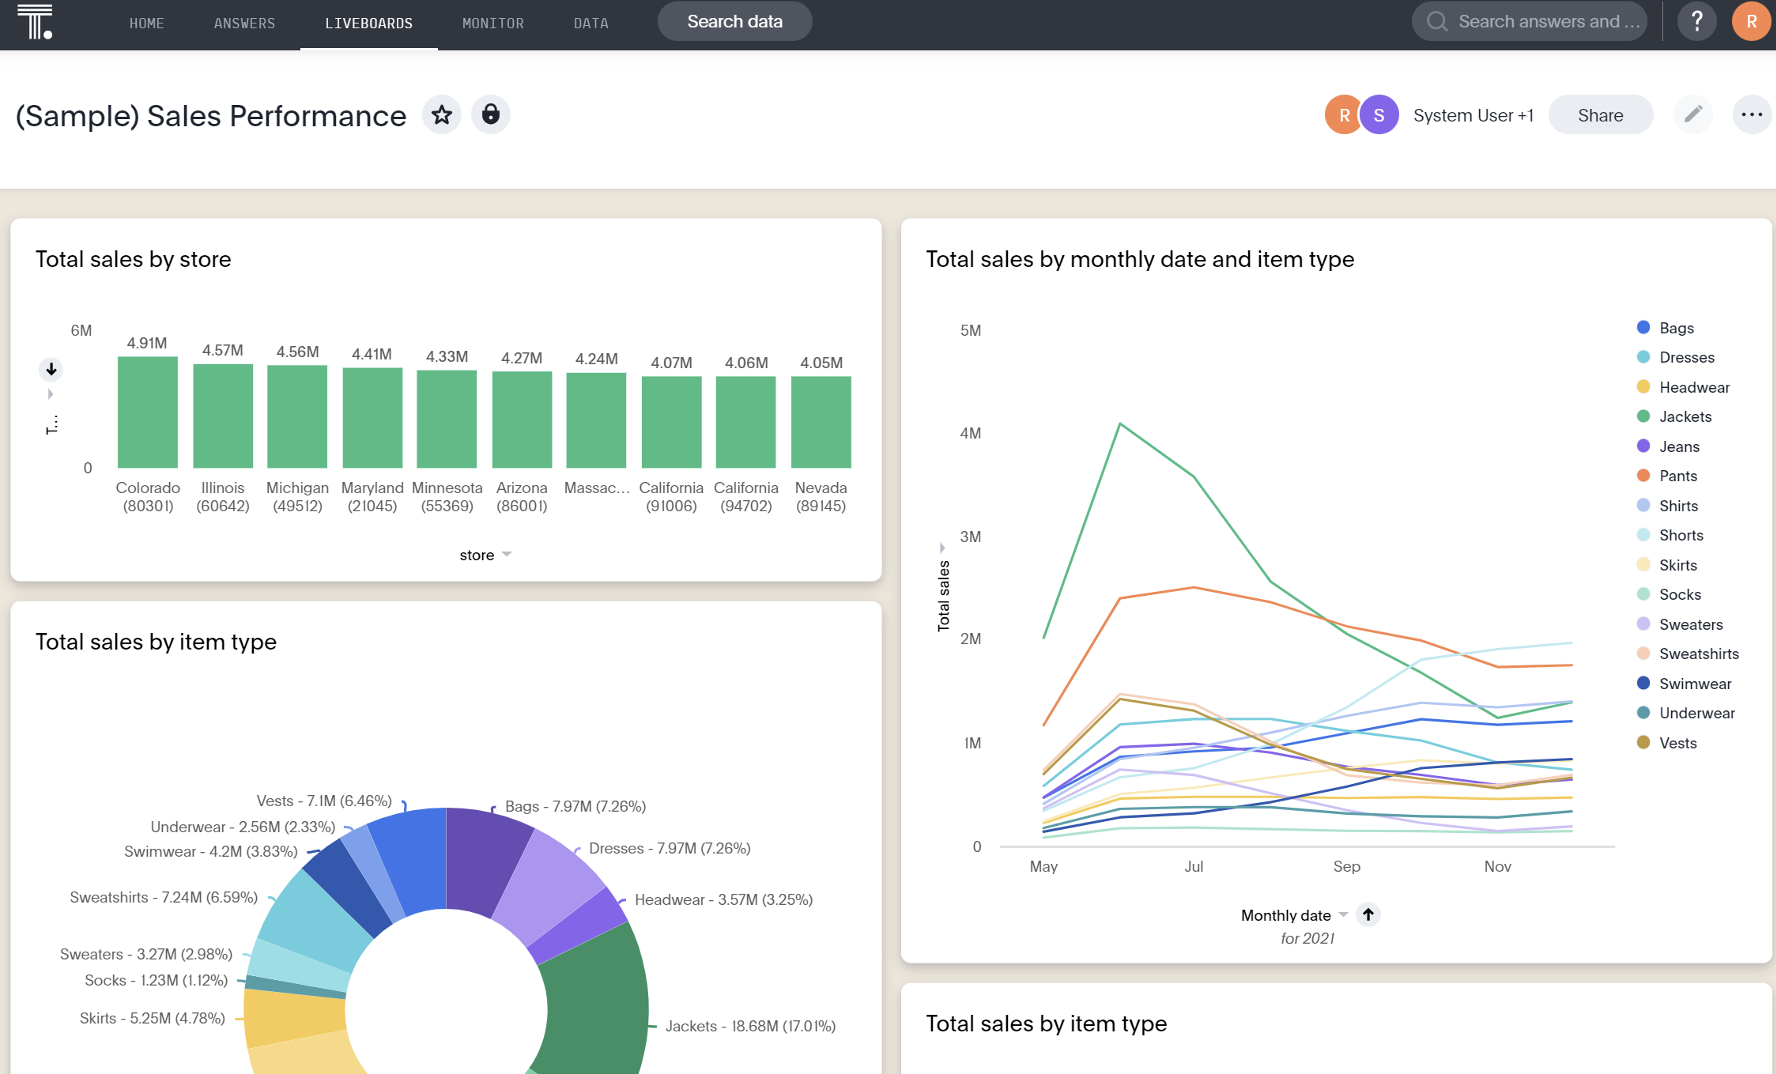
This is truly about making technology work for people, rather than it being a blocker or obstacle to making sense of your data. A meaningful experience doesn’t have to be about having the greatest design or making a dashboard “pop.” It’s simply about bringing your data to life quickly and letting your masses jump into a journey that is most relevant to them.
To summarize: the entire data experience as an end user in ThoughtSpot is centered around searching. ThoughtSpot is one of the pioneers, having developed a search engine bot that sits on top of your data and learns from your search habits. And using a few quick keystrokes, I can see important numbers and KPIs that are visualized and save them as answers to be shared with others on a liveboard.
We’re just scratching the surface, but this is a good start. Again, let us know if you have any questions around ThoughtSpot or would like more information on getting a free 2-week trial of the application.