
Back to work here, Part II of my “Learn ThoughtSpot with Me” series. I hope you enjoy it.
Buckle Up
In my initial post, we talked about the basic interactions in ThoughtSpot. For a typical user, we defined some of the key language, functionality, tools and reporting provided by the system. More specifically, we helped introduce how Worksheets, Answers and Liveboards are all universal objects related to an end user’s experience inside of the application. We’re collectively chasing down data stories and hopefully doing that with minimal effort and time needed to get to those insights.
Oftentimes, I like to describe the stages of a data journey as an exploration. I know you can all remember back to your school days some of those famous explorers from history class. Names like Columbus, Magellan, Vespucci, Coronado, Ponce de Leon, Hudson, Ross and Cook all come to my mind. They were at the forefront of their times.
And now, you are too.
At your disposal are AI-powered Analytics in ThoughtSpot. The on-demand platform is a fully integrated experience based on data that sits in your warehouse or private cloud. Through a digital stewardship effort, all users within a company become empowered to consume and analyze live data. This is your company’s data “frontier.”
Thus, your expedition begins.
If you want to dress the part with an explorer scope, compass and a pointy hat, while standing on the bow of a boat, feel free. Your only requirement to access your organization’s ThoughtSpot instance is going to be the Internet along with a unique login ID & password (SSO is provided for authentication as well). From there, permissions are granted, and users are set free to search and share.
Follow, Filter and Format
Not all words that start with “F” are bad.
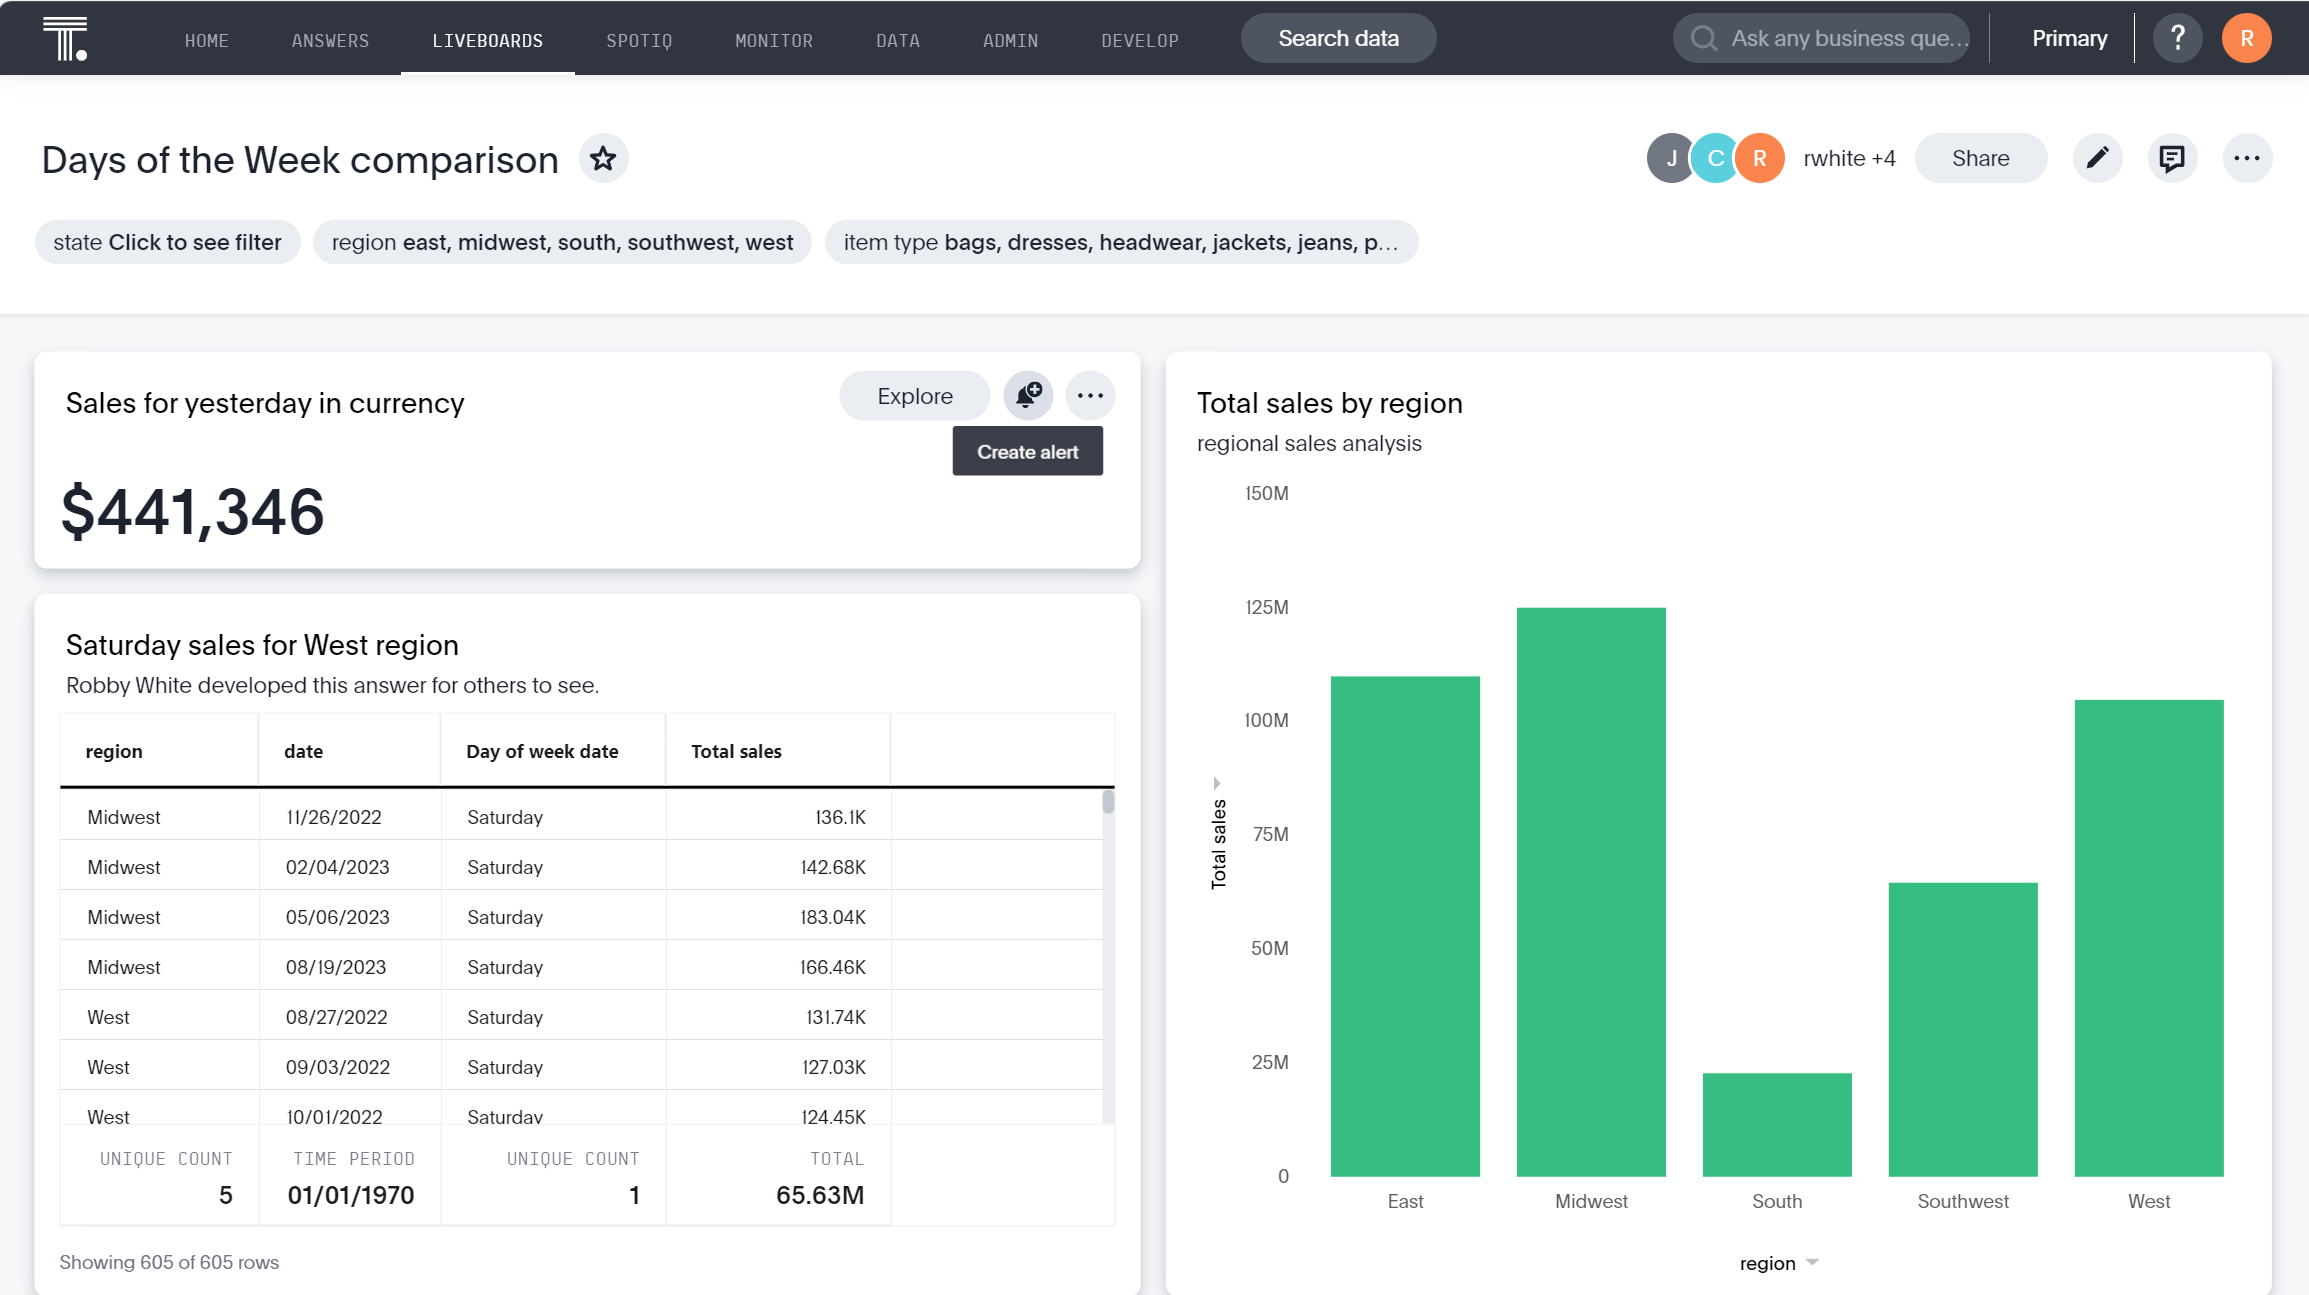
Oftentimes, we will want to see our most important numbers from our data on a regular basis, and ThoughtSpot gives users lots of ways to do so. From a Liveboard, you’ll see pinned (and typically related) answers to show as a collection of insights. But, if one of the answers houses an essential metric that you might want to follow and/or receive conditional (i.e., threshold-driven) updates to, there is a way to “Monitor” that value directly. From any Liveboard, you can locate one of the pinned KPIs and, while hovering, you’ll notice a bell icon with a plus next to it. Simply left click that bell, and it generates a new metric that will get monitored going forward:
The admin of your ThoughtSpot instance decides the cadence intervals for the monitor function, so these could vary from monthly notifications all the way down to hourly if needed. You can subscribe to the monitors once they have been added, and others may subscribe themselves as well:
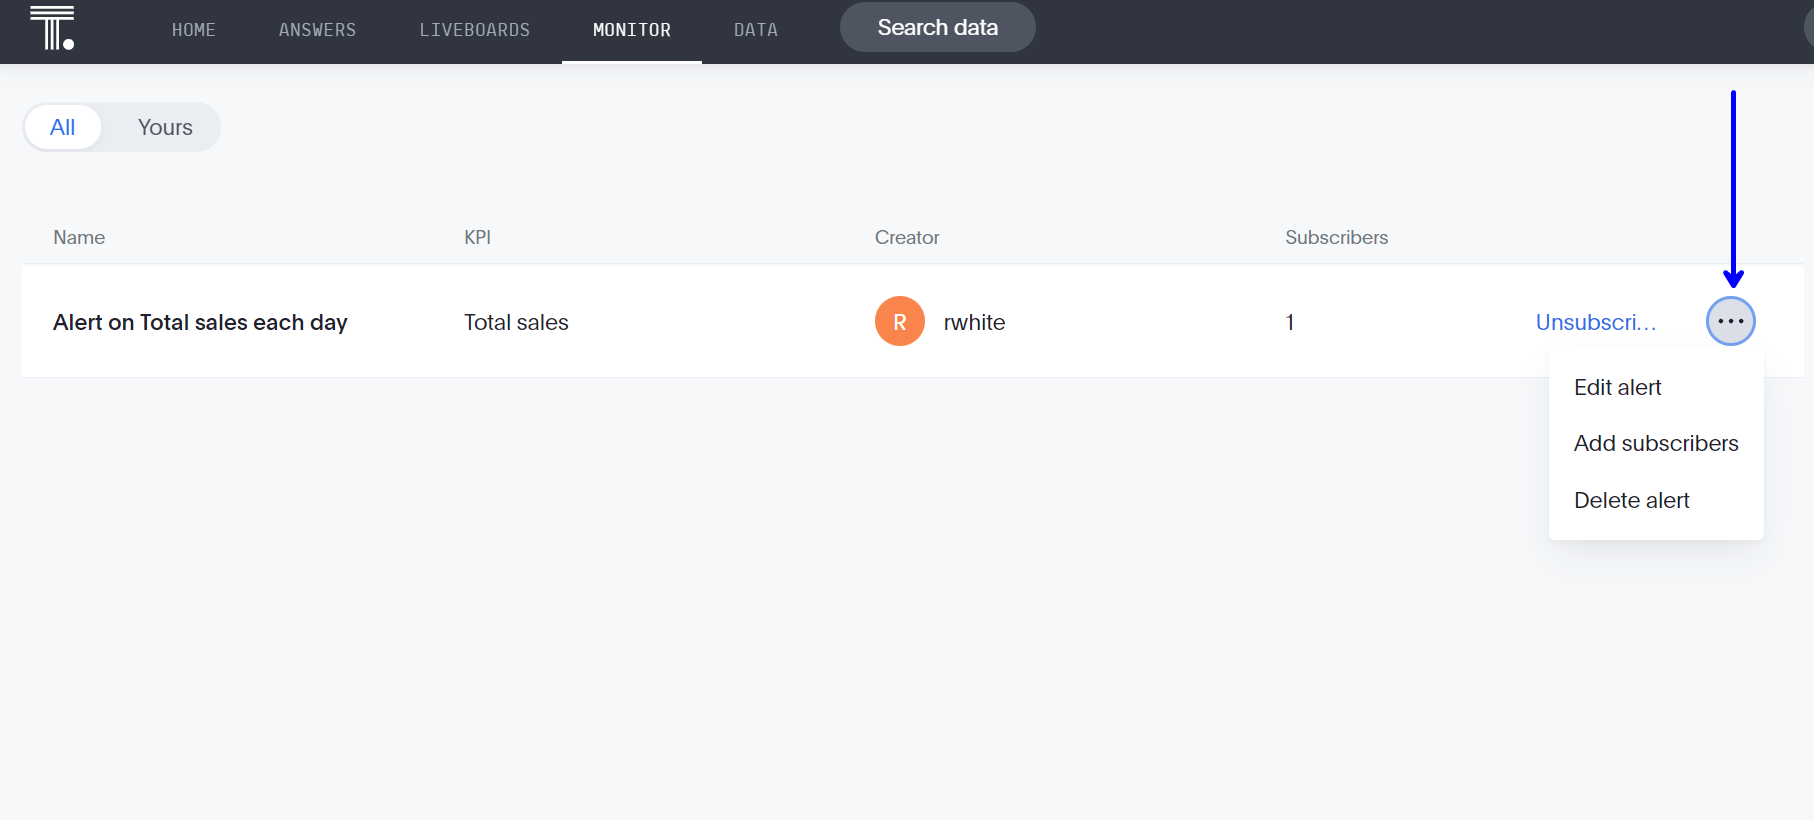
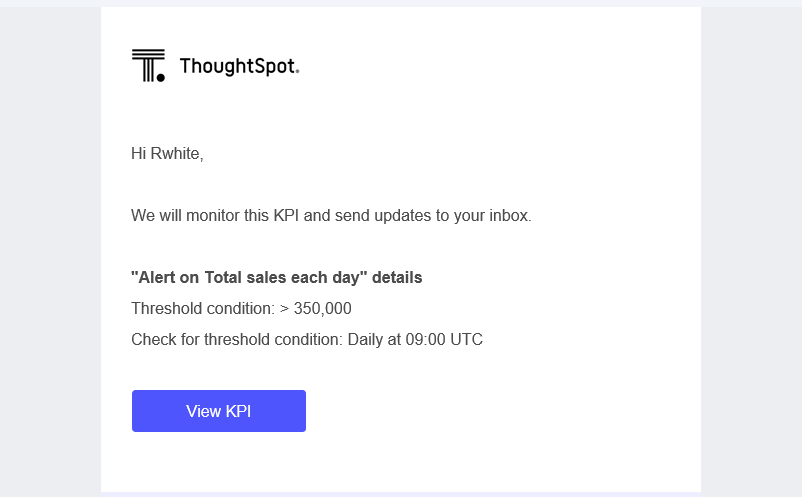
When a specific condition or threshold is met for that metric, it will trigger an update within ThoughtSpot that gets sent out in the form of an email to anyone on that subscriber list. Again, the monitors can only be set on saved answers that are using the KPI chart-type:
There’s also a “Watch List” from the top of your ThoughtSpot Home page, which can be used to follow important KPIs that are most meaningful to you. The KPIs can be added to your watchlist from any available saved answers or Liveboards:
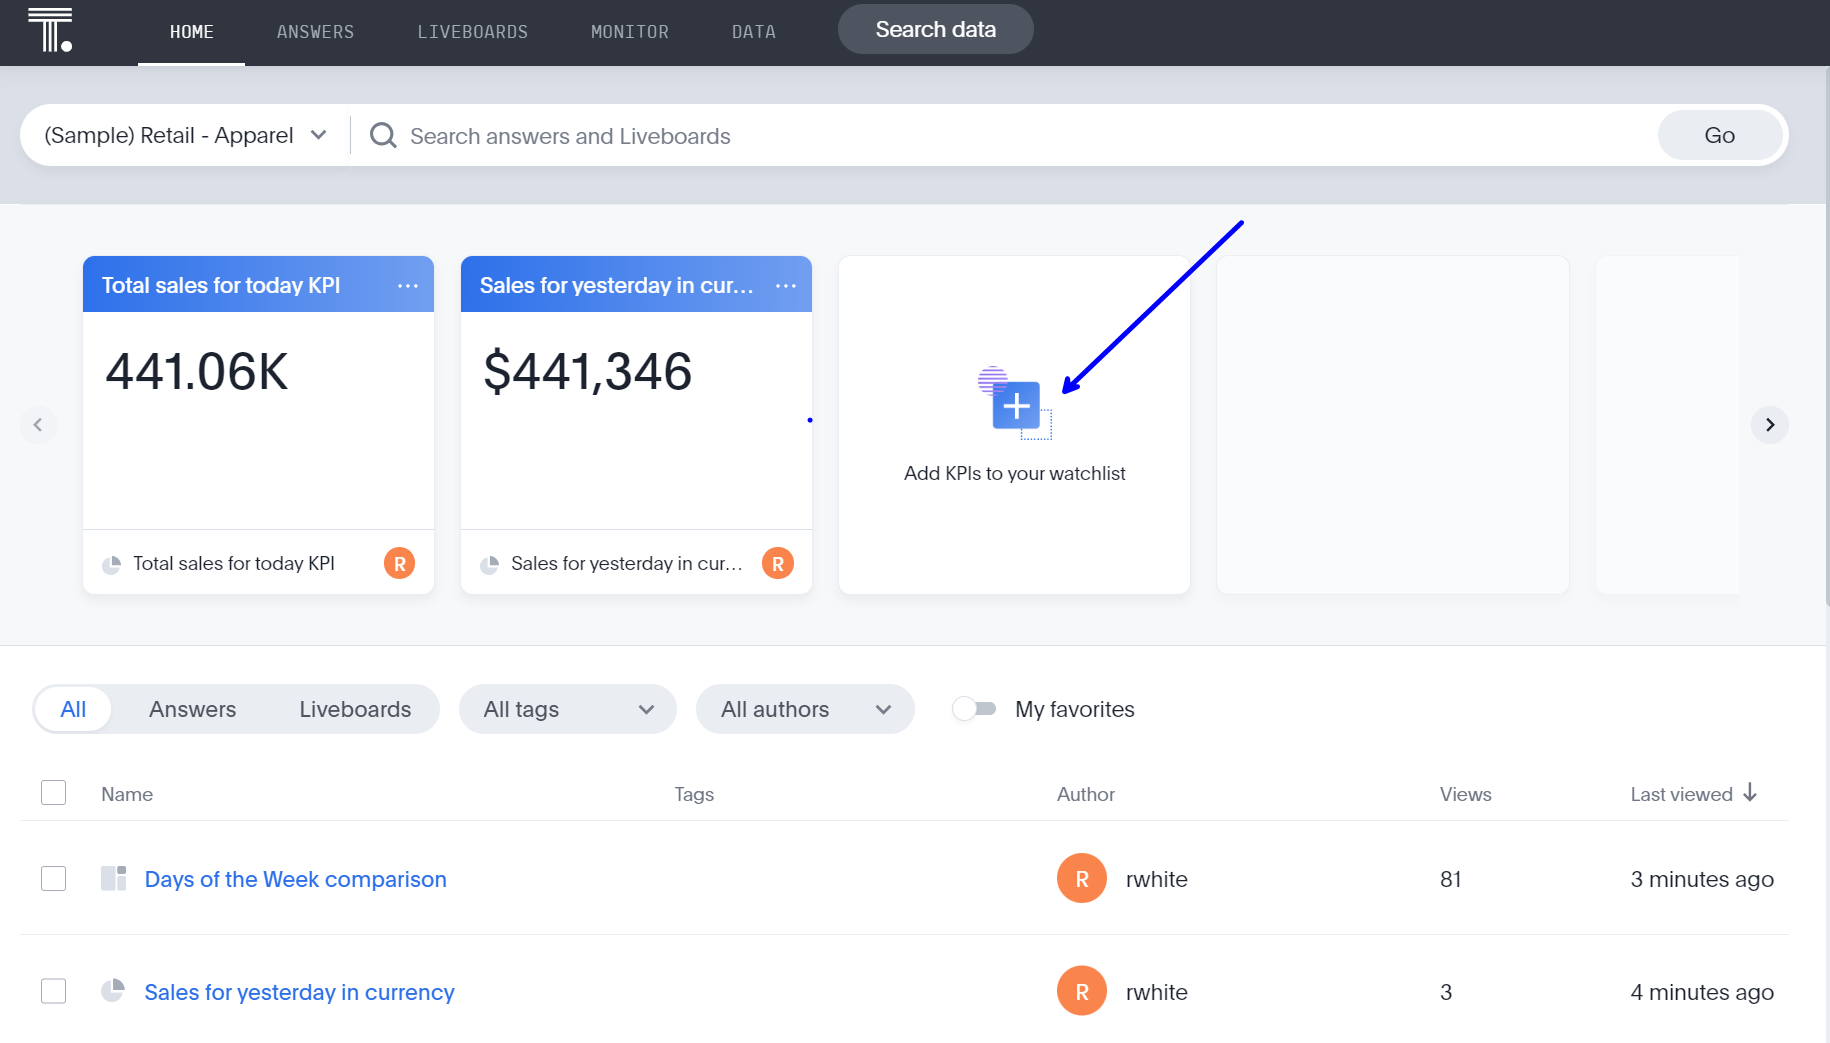
For those who might be unfamiliar, “KPI” stands for Key Performance Indicators. These are the front-and-center numbers that are typically shown in their raw form, usually as a collective sum or total. Stakeholders love these, as they can oftentimes be a standardized means to understanding targets or even the general financial health of an organization. In most instances, KPIs aren’t going to be broken down for individual perspective. They’re just Big Ass Numbers. That’s where filters might be helpful:
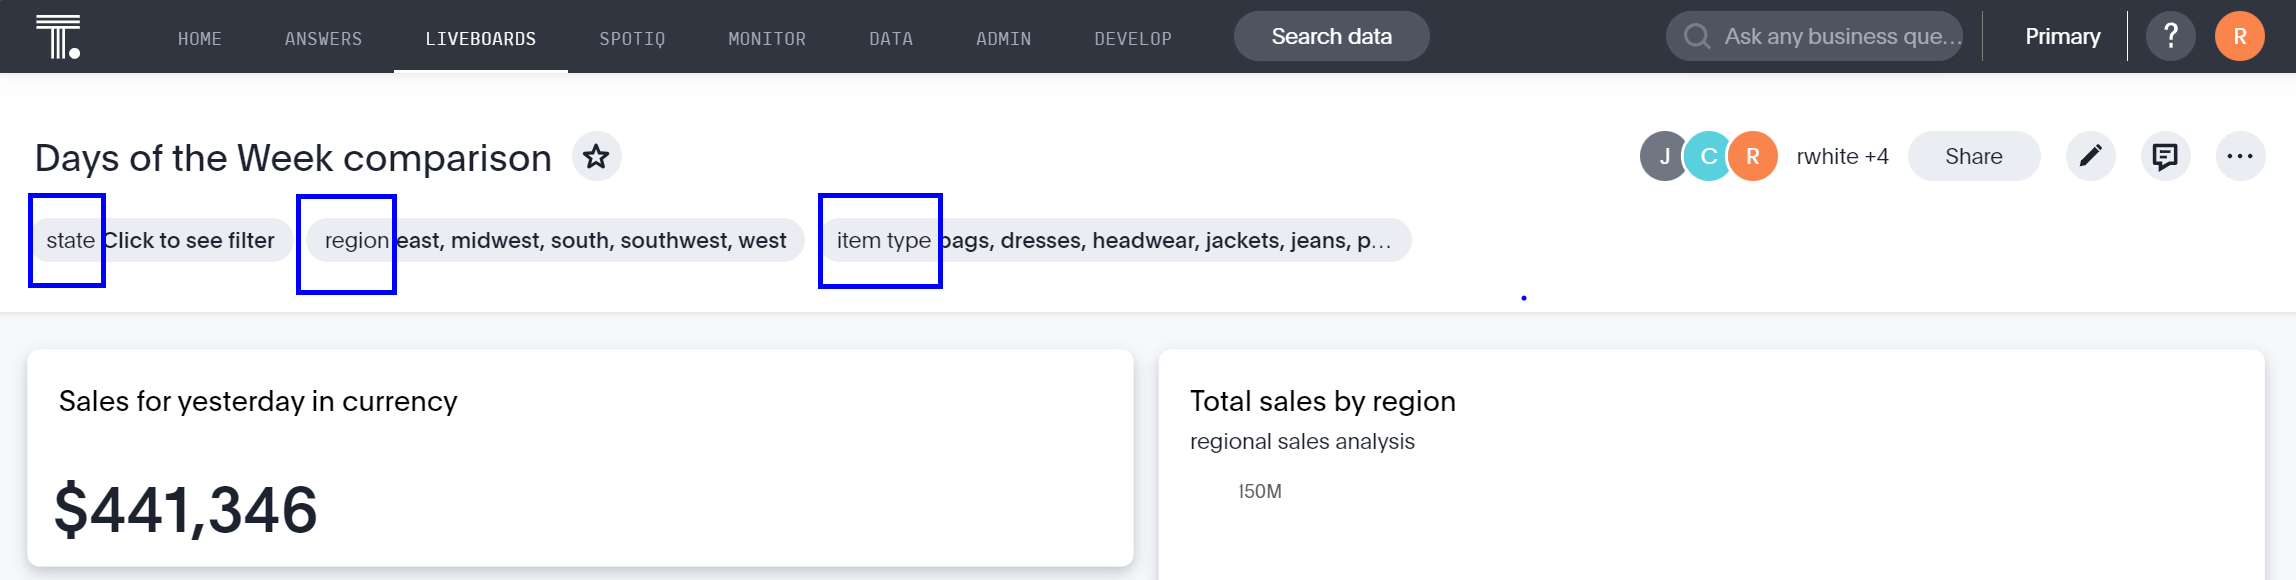
From a Liveboard, an end user will be able to filter to see specific details that are more meaningful to their everyday functions. Most of the time, the owner of a Liveboard will have pre-determined filters already in place that an end user can select right out of the box. They are at the top of each Liveboard, and some may even be mandatory selections before any subsequent Liveboard details are shown.
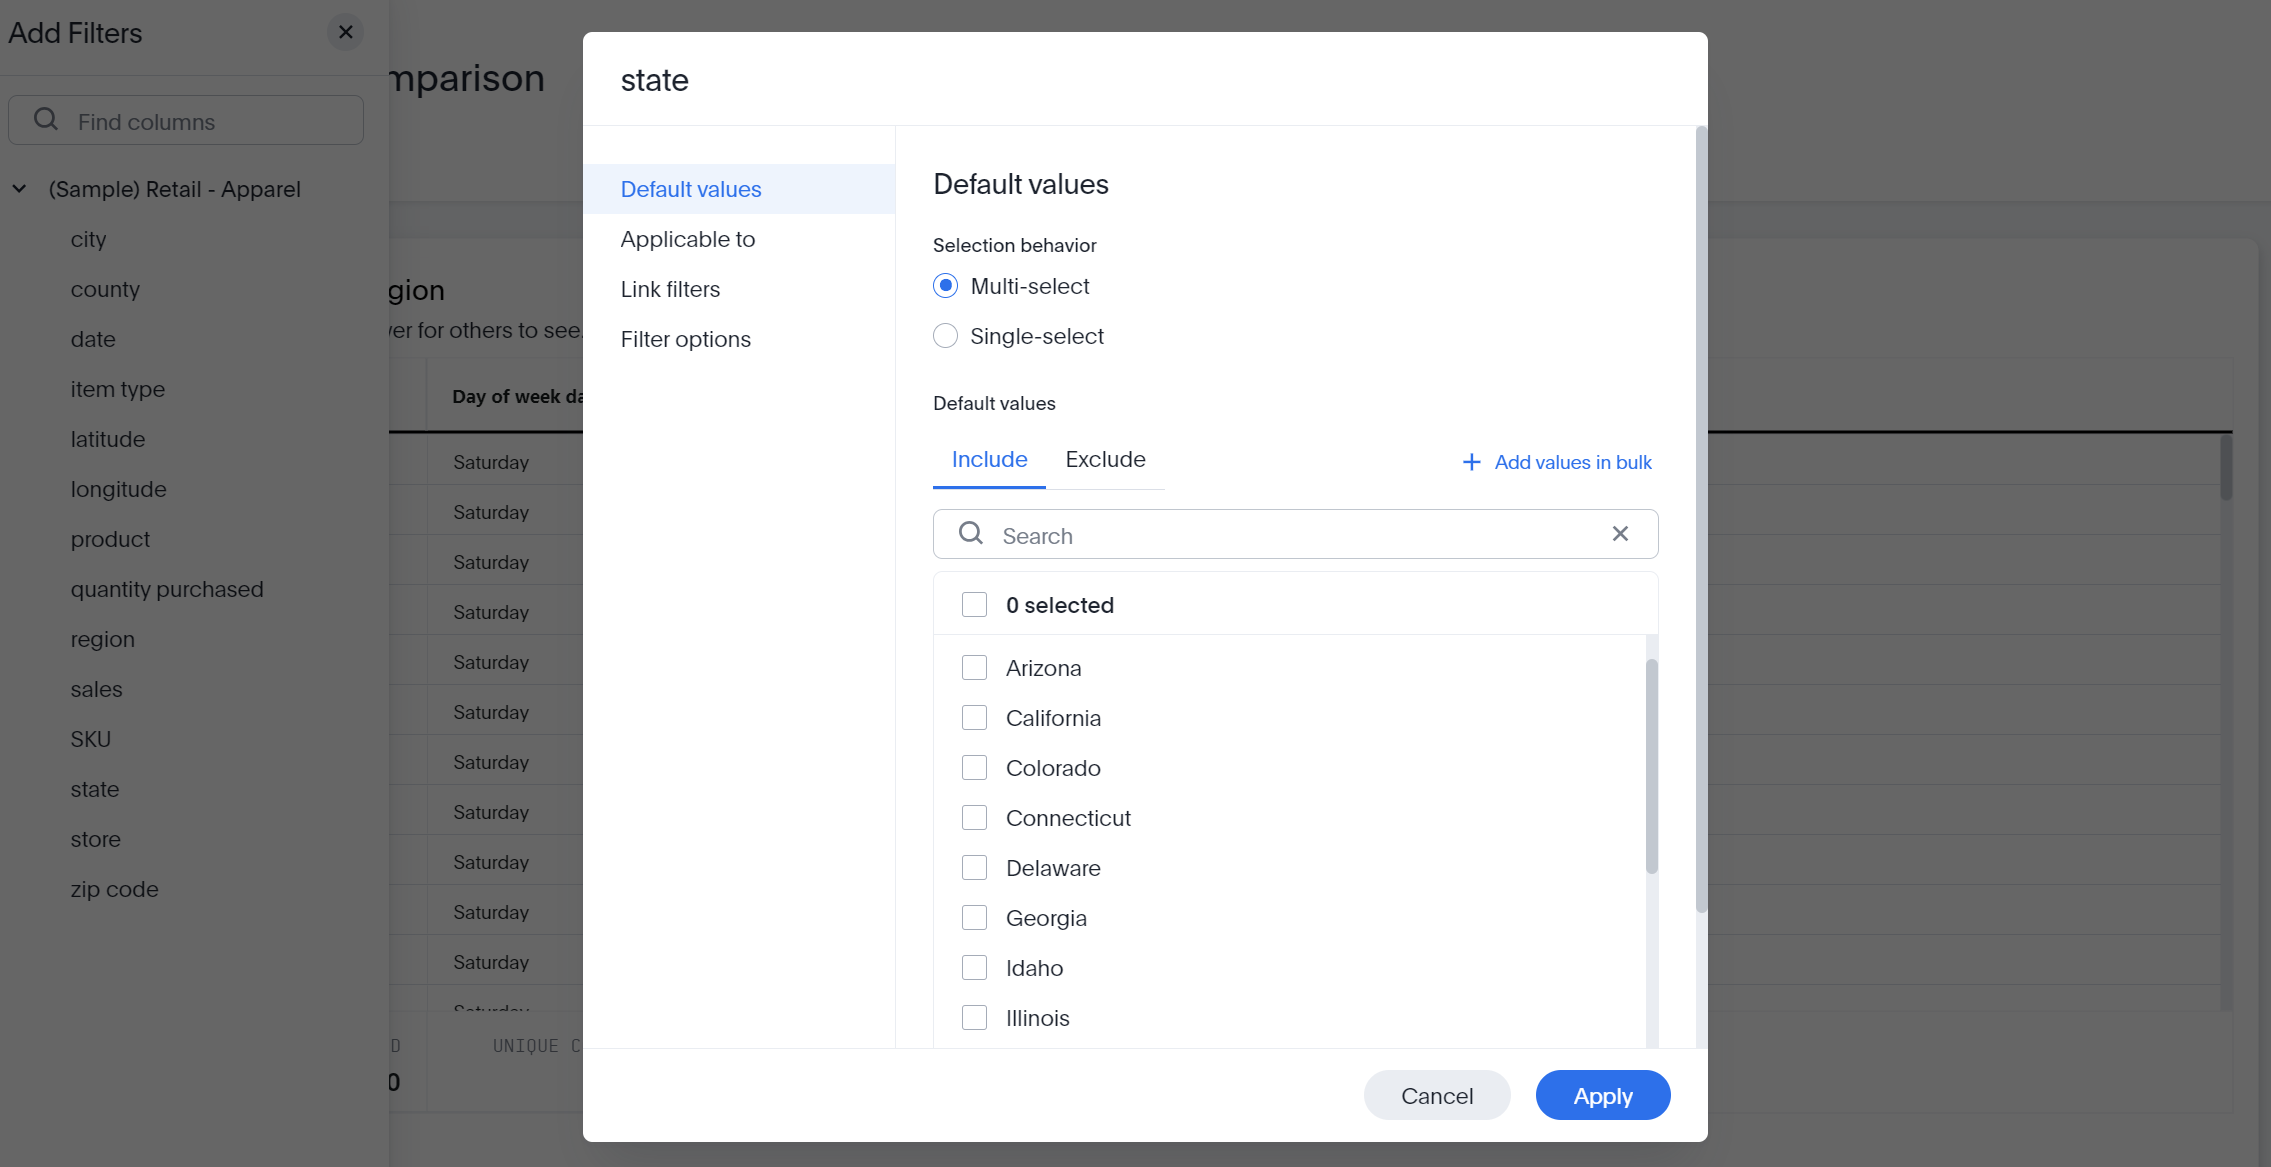
The create filter interface is very intuitive but, thankfully, the owner of a Liveboard doesn’t have to think of every filter an end user might need because ThoughtSpot offers a unique drill-down capability within the views. While hovering over the marks within a chart, an end user can right-click and choose to drill-down further based on more granular options:
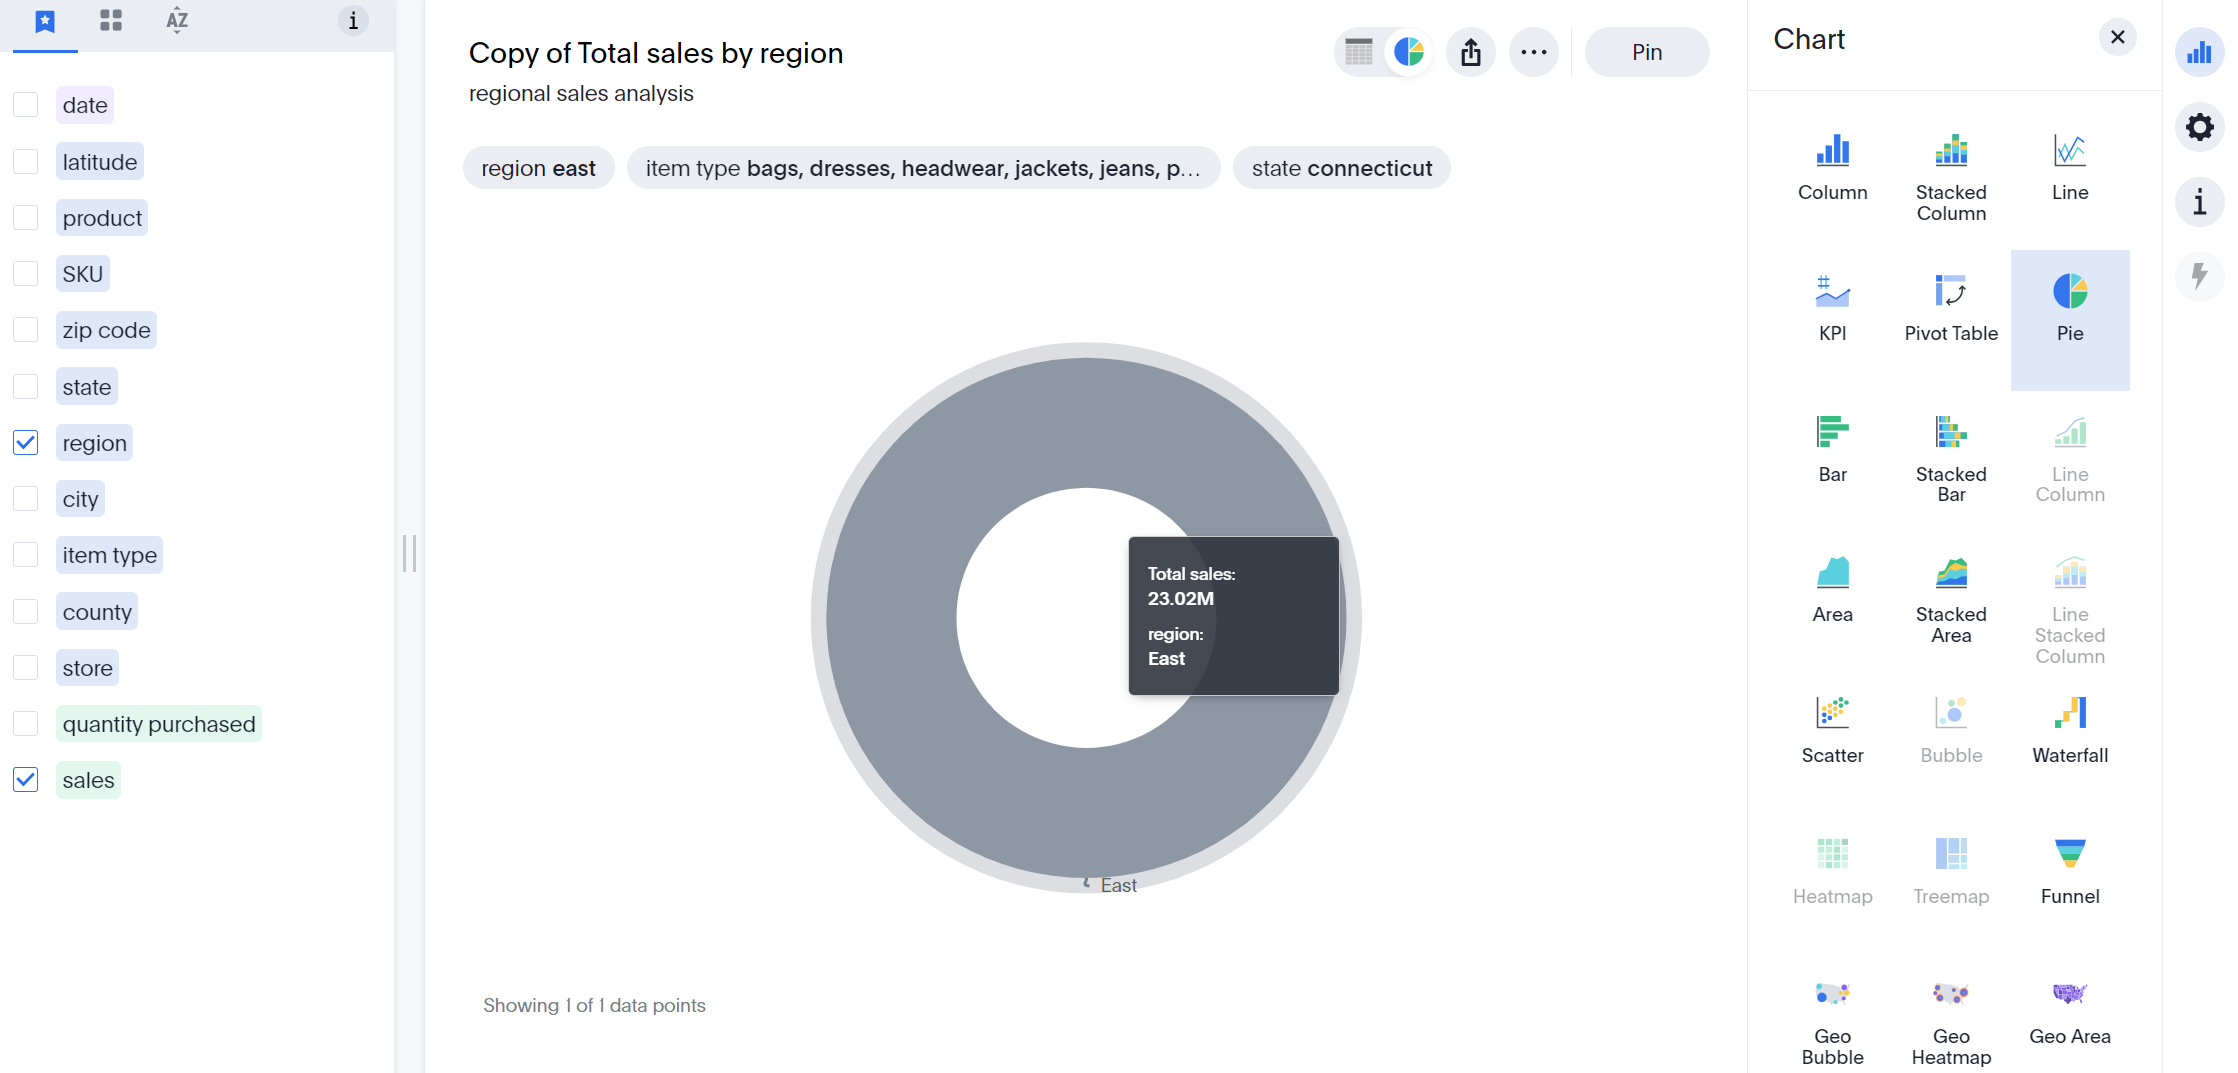
The drill-down views produced can be reset, copied or pinned. If permissions allow for editing, or if the drill-down view was created as a copy, additional format changes to the chart type (try out the Funnel to represent stages of sales), colors, settings, search terms, key words, axes, legend placement and labels can be made.
Filters are available when building worksheets, searching across your data, constructing answers or viewing a liveboard. Filters are your “limit-your-data-in-the-view” control. Formatting can be done from within the answer before you save or pin it. Oftentimes, you’ll want to use your own colors to encode bars or highlights that are present. Color changes can be made directly from the legend on the answer page.
Ultimately for me, though, the ability to follow or subscribe to my actionable metrics really becomes the bread and butter of my own ThoughtSpot experience. Visualized metrics are how we quickly uncover positive performances worth celebrating or locate problems that need to be addressed today. I keep my watch list loaded with KPIs, so that becomes the first thing I see when I log into ThoughtSpot.
No longer do you have to scan a wall of numbers and work to get insights or wait on someone to share details with you. The true power granted to you in ThoughtSpot is your own ability to circumnavigate your company’s data frontier as a singular source of truth to find those discoverable data trends and analyses. There are no borders or boundaries stopping you. Those explorers of old would appreciate that in today’s digital age. As one of America’s greatest authors writes:
“And this I believe: that the free, exploring mind of the individual human is the most valuable thing in the world.”
-John Steinbeck
Stay tuned for my final part III of this series, where we go beyond the basics. And, a free ThoughtSpot trial can be found by clicking here if you’d like to explore some of these features yourself.