
How do you measure the hard and soft benefits? Some improvements are easy to measure because you can point to a singular discovery that led to improvement. People love showing others how their discovery improved efficiency or illuminated a previously unknown issue.
Record these success stories, quantify the value produced and keep a running total of the cost savings, margin improvements or sales growth.
An Illustrative Story
A little over 14 years ago, a friend started working with a new data visualization (dashboard) tool. He had been recently promoted to work in his company’s marketing department as a data analyst. This consumer products company produces one of the best-known brands in the world.
His boss gave him a data set during his first week on the job and asked him to analyze it as a learning exercise. This data included details sales and margin data for one customer and a single product size. He was able to surface a significant insight by mapping sales and margins by retail location.
His analysis looked like the map below.
The size of each circle indicates the dollar amount of sales within a retail location. Greater sales are displayed via bigger circles. The intensity of the color within the circle denotes how much profit came from those sales. Gray to white colors meant higher profits. purple colors, less profit. The lowest profit locations have the darkest purple colors.
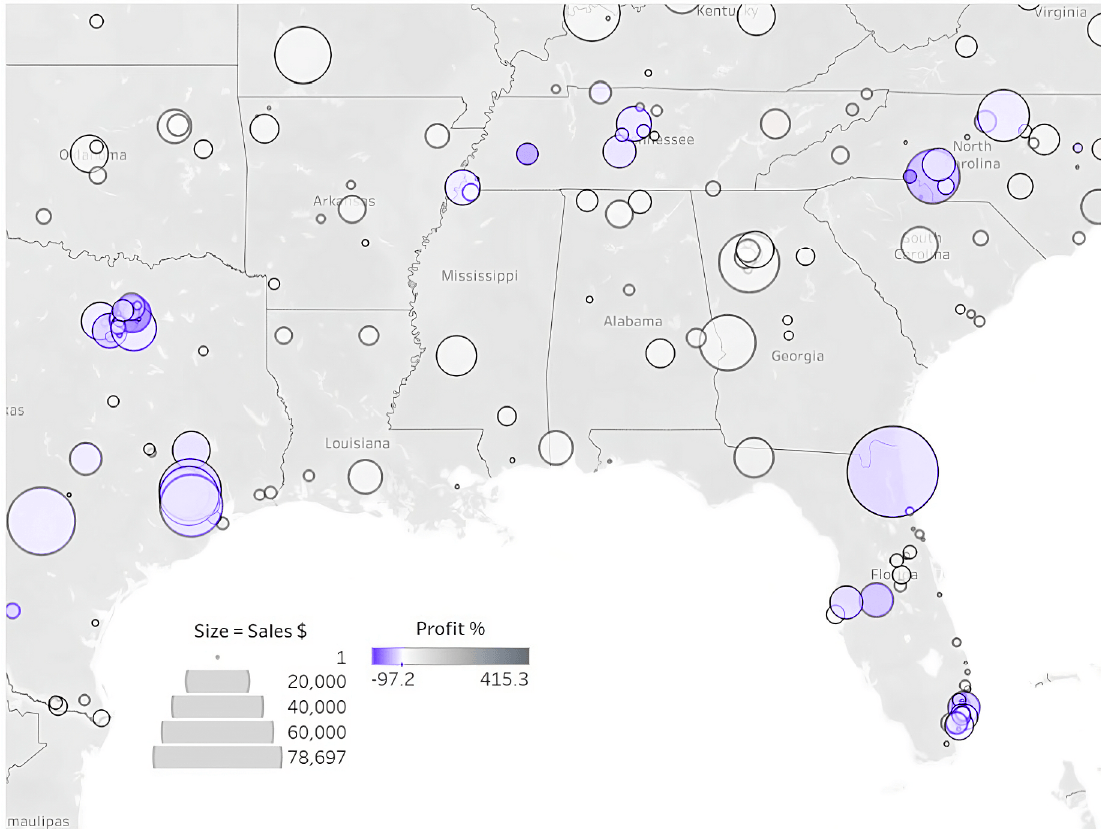
Figure 4.3.1 Sales and Profit by Store
This map revealed an interesting pattern—some of the large circles on the map were the deepest shade of purple. Some locations with high sales volume had lower profits, below the minimums established by the company.
Pointing the cursor at a specific circle caused the sales dollars, profit dollars, average selling prices and profit percentage to be displayed. Note the size and color legends below the map.
My friend wasn’t sure why this happened, so he shared it with his boss. His boss realized that these retail locations were selling products below the company’s minimum price levels established by the company. My friend visited the customer later that week to show the dashboard to their executive leadership.
Previous sales reporting didn’t display the information in sufficient detail to surface this information. The reports were static. The opportunity to improve flew under the radar. Remember, he was drilling into a single product before the outliers became visible.
Nine months later, this discovery (done for fun and learning) resulted in millions of dollars of gross margin improvement for this customer.
My friend started without preconceived ideas of what he might find, and the data led to meaningful insight and outcomes.
Capturing Success Stories
Establish a capture system to record success stories reported by anyone in your company. Publicize success stories and report cumulative impact every quarter. Create an internal reporting portal to capture and share success stories. Put someone in charge of vetting them and gathering more financial details about the outcome. Assign an accountant to validate the figures.
Keep a permanent record of success that is verified and trusted. Over time you can add the data quality improvement impacts we discussed in (Incentivizing Data Quality) to the measurement system as well.
Cultivating data culture is an ongoing process that recognizes data is not an asset. Data converted into insightful information is an asset.
In this context, giving managers a reason to work on the data quality produced by their workflows makes good sense. Allocating a portion of incentive pay to this goal sends the message that management expects data quality to be a priority.