
Launched in Desktop 2022.4, “Image Roles” allow you to add an additional semantic field to give end users another way to view their data. This allows you to include images at speed and scale by utilising a URL link within your data to feed straight into your dashboard.
Firstly, we need to cover the prerequisites to ensure the images we use will load into our dashboard without issue
- Images need to be accessible within a non-password protected location accessible by Tableau Desktop, Cloud or Server
- Images must be in PNG or JPG format
- Files must be a maximum of 128 kb
- URL must end in .png, .jpg, or .jpeg
- Images no bigger than a credit card work best, but ensure you get the highest quality to fall within the above parameters
Now we have that out of the way, let’s get to the fun side and stand building out the feature.
I have used a sample piece of data for 20 countries and their respective Population, GDP and life expectancy: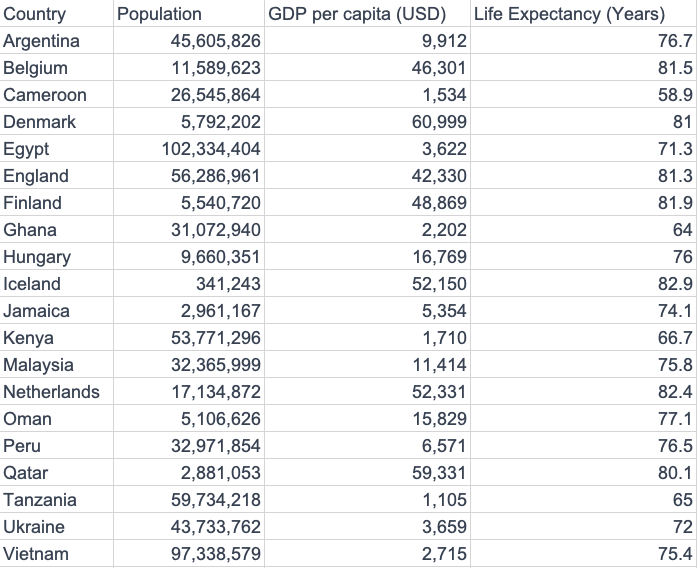
We have the data, so let’s start adding some image URLs and see how it looks in Tableau. Open up the data in Excel and add a column at the end called “Flag.” This is where we’ll add the URLs to use.
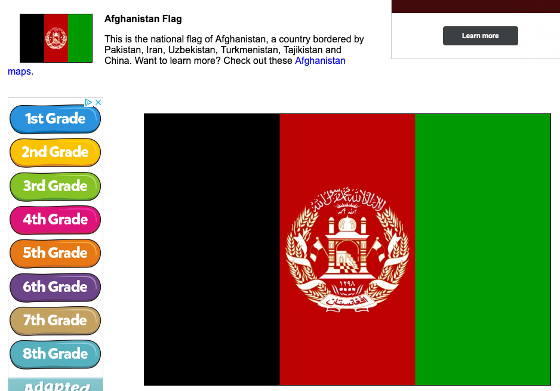
I found a free resource of flags on a “Science Kidz” website that we will use to populate our URLs. I know it’s for kids, but please don’t judge me. A good resource is a good resource!
Let’s click the Afghanistan flag first and look at what we can use. The larger version looks too big for my use case but the top left seems perfect:
How do we get the URL to use? Right click the image and click on the “Open Image in New Tab” options:
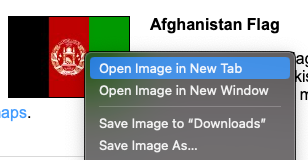
The URL of this new page is exactly what we need, it meets all the prerequisites from earlier, copy this and paste it under our flag column in Excel for Afghanistan:

We don’t want to do this for every flag though, so how can we expedite the process? We can use the concatenate function to pre-populate the structure of the URL.
Below the Flag URL for Afghanistan lets add this:
=concatenate("https://www.sciencekids.co.nz/images/pictures/flags120/", A3, ".jpg")
Then, let’s press enter. You’ll see this built the URL in the same structure as previously but utilised the country cell for Belgium to add the name dynamically. Drag the calculation down and populate all the URLs for all Countries. Now if we had 100 countries in our data, we’ll spend less time prepping and more time building out the Tableau visual.
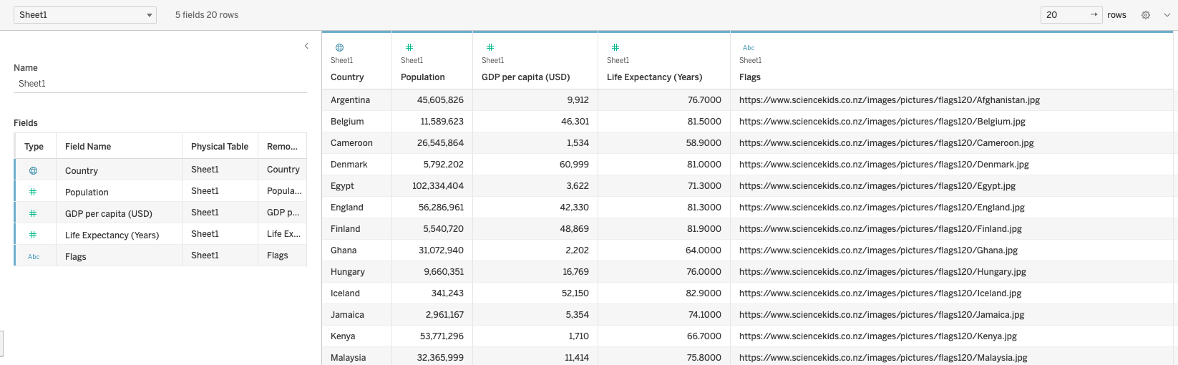
Now that our data is prepped, let’s open Tableau desktop using version 2022.4 or higher. Connect to our new Excel data and examine it within our data pane and check it all looks as expected:
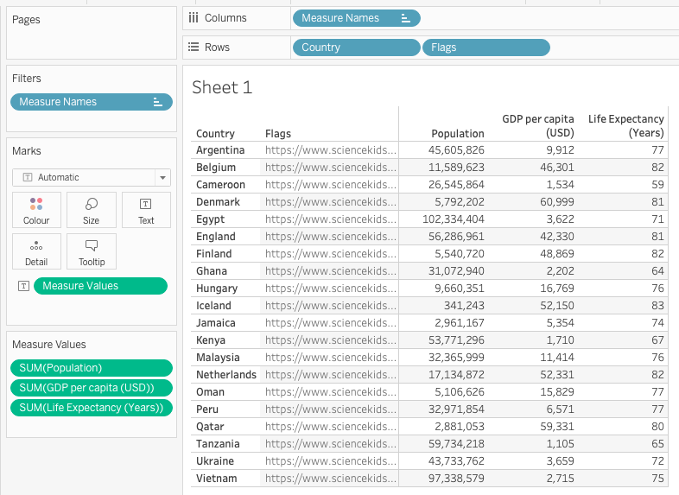
Navigate to Sheet1 and build out a nice table of data with our Flags.
We will add “Measure Names” to both Columns and Filters, “Country” and “Flag” onto Rows and “Measure Values” onto the Text Marks card. We will have one measure we don’t need, so remove CNT(Sheet1) and order the values as “Population,” “GDP per Capita (USD)” and finally “Life Expectancy (Years)” so it looks as below:
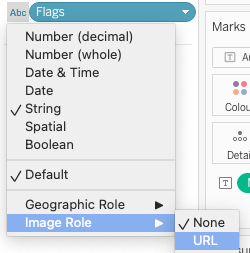
But wait! Where’s our lovely flags we just spent time finding? We want to change the datatype of that field, on the left click “Abc” next to Flags, click Image Roles and then URL:
Now, look at our table and see the colourful flags populated next to the country:
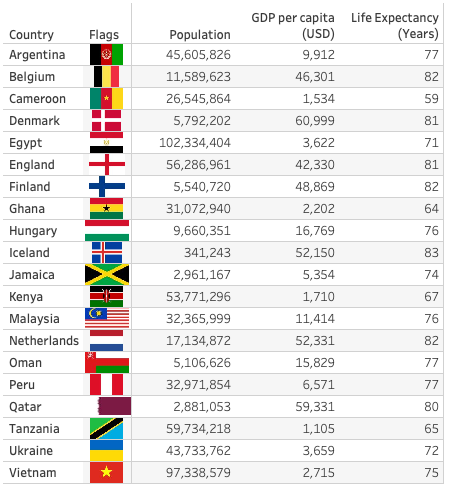
With this feature, we can quickly see how, with the right structure of URL, we can scale this feature to thousands of images quickly with little effort. Other use cases could include SKU level article images for retail products, headshots for employees on a HR dashboard or inventory/category level for warehousing. Images translate better than words globally with different languages, so it can add real value to end-users. Just be sure to keep in mind the performance of dashboards vs. visuals for user experience. If you want more Tableau from us, feel free to reach out!