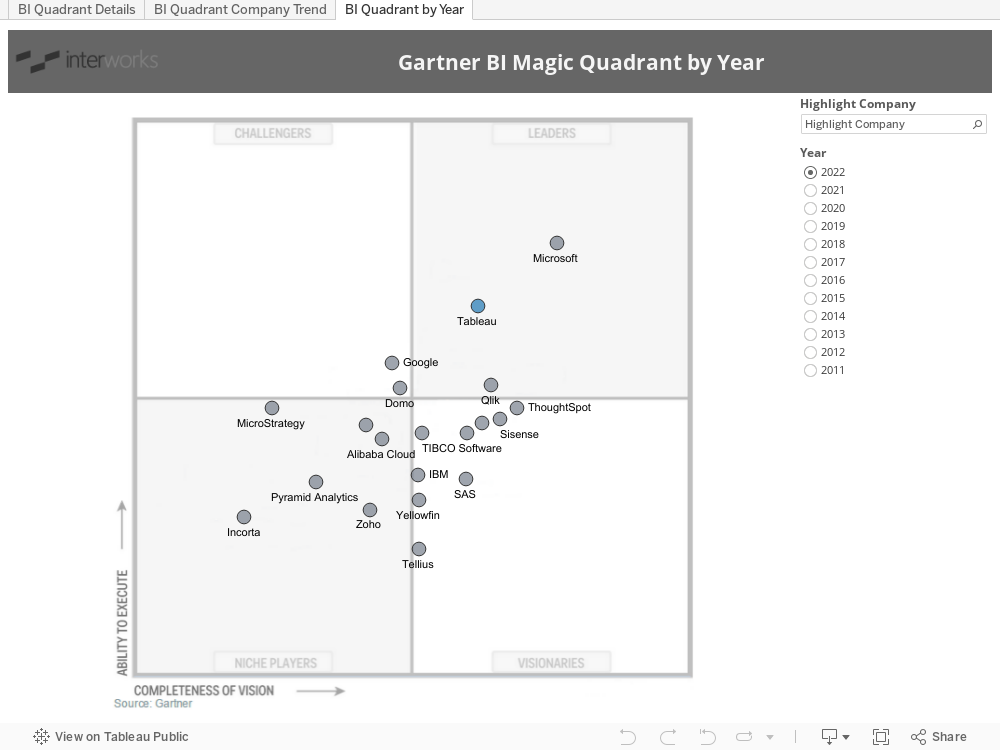
Gartner has released its annual Magic Quadrant report for 2022, and, per tradition, I’ve visualized the report in Tableau. Each year, the report announcement is highly anticipated as people look to see who and where Gartner has decided the BI industry’s movers and shakers are. Assessing companies through four different market lenses—leaders, visionaries, niche players and challengers—Gartner offers its researched perspective on the best solutions available. While it’s always enlightening to see which organizations have shifted positions, what newcomers are on the list for the first time and what organizations have dropped off the list, it’s good to bear in mind that this represents one company’s point of view. Explore the viz below: