The 2021 Gartner BI Magic Quadrant Visualized in Tableau

Data

The 2021 Gartner BI Magic Quadrant Visualized in Tableau

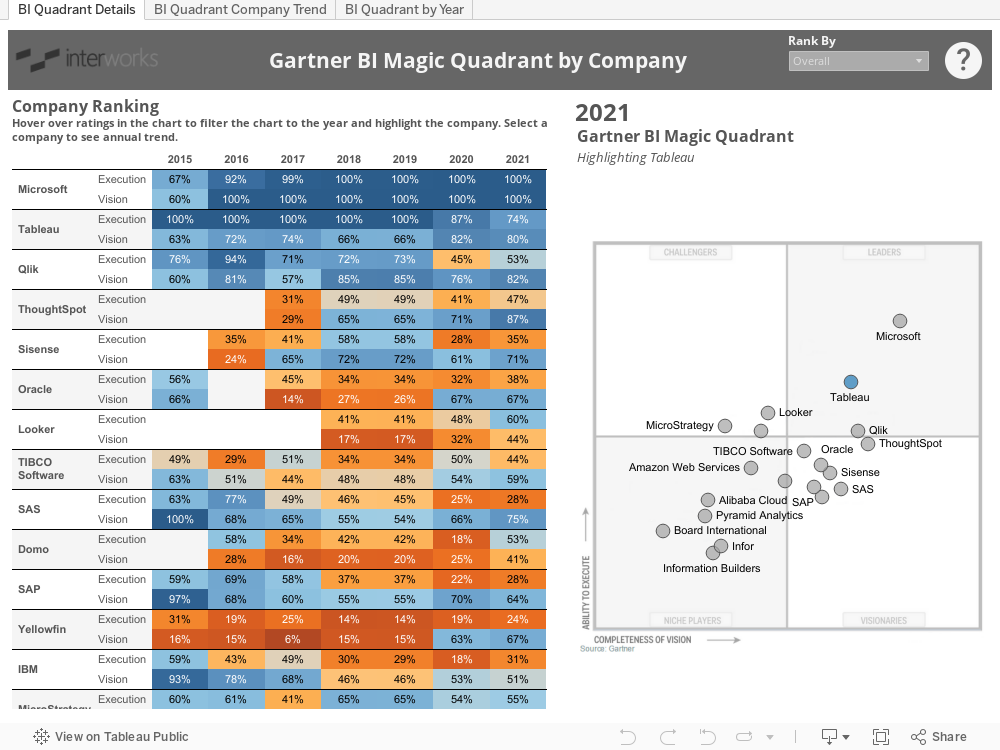
It’s that time again: Gartner has released the BI Magic Quadrant for 2021. This announcement is highly anticipated every year to see where Gartner has ranked BI companies. The factors they use include things like execution and scope of vision, and there has been some notable movement this time around regarding who has been included – and excluded – from the list. The release of the BI Magic Quadrant also gives me the opportunity to carry on a tradition here on the blog and visualize the results in Tableau. The goal is to convey how these platforms have changed over time according to Gartner’s criteria, but it’s always worth noting that Gartner’s perspective is just one of many. Feel free to check out the past explorations of this data, and dive into the viz below:

KeepWatch by InterWorks

Whether you need support for one platform or many, our technical experts have you covered.

More About the Author

Kent Sloan

Services Lead
Tableau Dashboard Optimization Checklist Tableau is a robust tool that allows you to build dashboards in a multitude of ways, which is part of what makes it great. The flip ...
Say Less: How To Ensure Your Tooltips Add Value We’ve all done it. We’ve completely ignored the warning label. You know, the one we probably see everyday: CAUTION: Contents Hot We ...

See more from this author →

InterWorks uses cookies to allow us to better understand how the site is used. By continuing to use this site, you consent to this policy. Review Policy OK

×

Interworks GmbH
Ratinger Straße 9
40213 Düsseldorf
Germany
Geschäftsführer: Mel Stephenson

Kontaktaufnahme: markus@interworks.eu
Telefon: +49 (0)211 5408 5301

Amtsgericht Düsseldorf HRB 79752
UstldNr: DE 313 353 072

×

Love our blog? You should see our emails. Sign up for our newsletter!