Does any of this feel familiar?
- Our end users struggle to find the dashboards they’re looking for in my Tableau Server / Tableau Cloud environment.
- Stakeholders are confused as to which dashboard(s) should be the source of the truth for reporting.
- Stakeholders aren’t sure what dashboard versions are the most up-to-date.
- There is outdated content in my Tableau environment.
- There is a lack of clarity on how dashboards are supported and maintained when published to Tableau Server.
If so, you definitely need to keep reading! In this blog, we’ll be walking you through better Tableau governance to alleviate some of these challenges.
A Foundation for Governance
But first, what is governance and how do we apply it? Let’s look at a real-life example to understand how we should start thinking about it and how it is applied. Imagine if you were at the grocery store and you were confronted with the following scene:

How easy do you think it might be to find what you needed? How long would it take you to navigate the store? We take for granted that every time we visit our local grocery store, we pretty much encounter the following scene:

For the most part, you know generally where you can look to find the items you need. Aisles are clearly labelled, and if you can’t find what you are looking for, you can always ask someone for help. There is so much that happens behind the scenes in the store to give you this consistent experience.
So back to the point: Governance is the combination of all the organization and management of the behind-the-scenes work that provides a seamless, frictionless experience for the users. It’s the combination of processes, policies and roles that ensures an organization can create trust and confidence in analytics. If you are set in providing your end users with a truly self-service experience, you must have good governance in place.
In this blog, we will discuss some universal principles that we think will support you in deciding on your governance policies, applicable to your Tableau Server or Tableau Cloud environment.
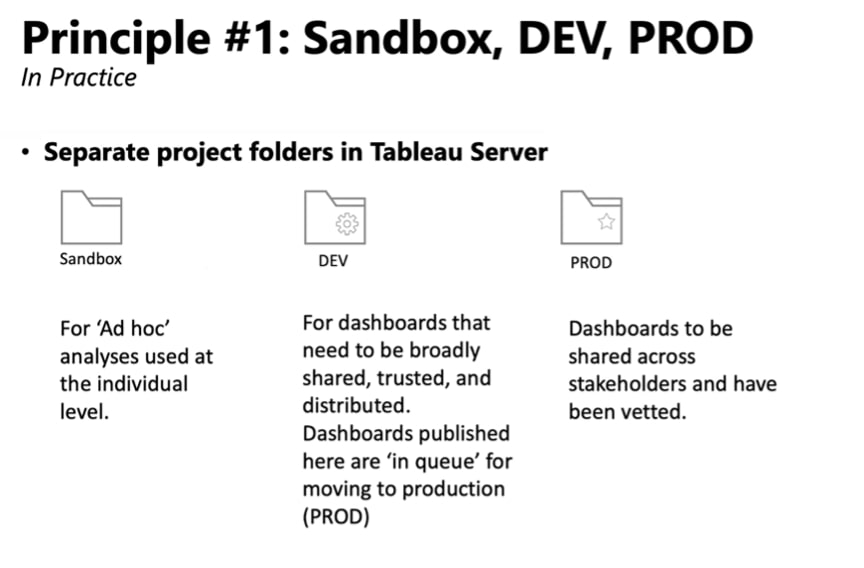
Principle #1
There are separate locations for the following:
- Sandbox
- Development*
- Production
* inclusive of Test/QA and UAT locations
If you are on Tableau Server, these locations may be Tableau sites or projects. If you are on Tableau Cloud, it will likely make the most sense to establish these locations as projects, since a single Tableau Cloud account permits only one site. The diagrams to follow illustrate these separate locations as Projects, a feasible and realistic option whether you’re on Tableau Server or Tableau Cloud.
Structure can also be replicated across functional areas or groups within a subfolder structure:
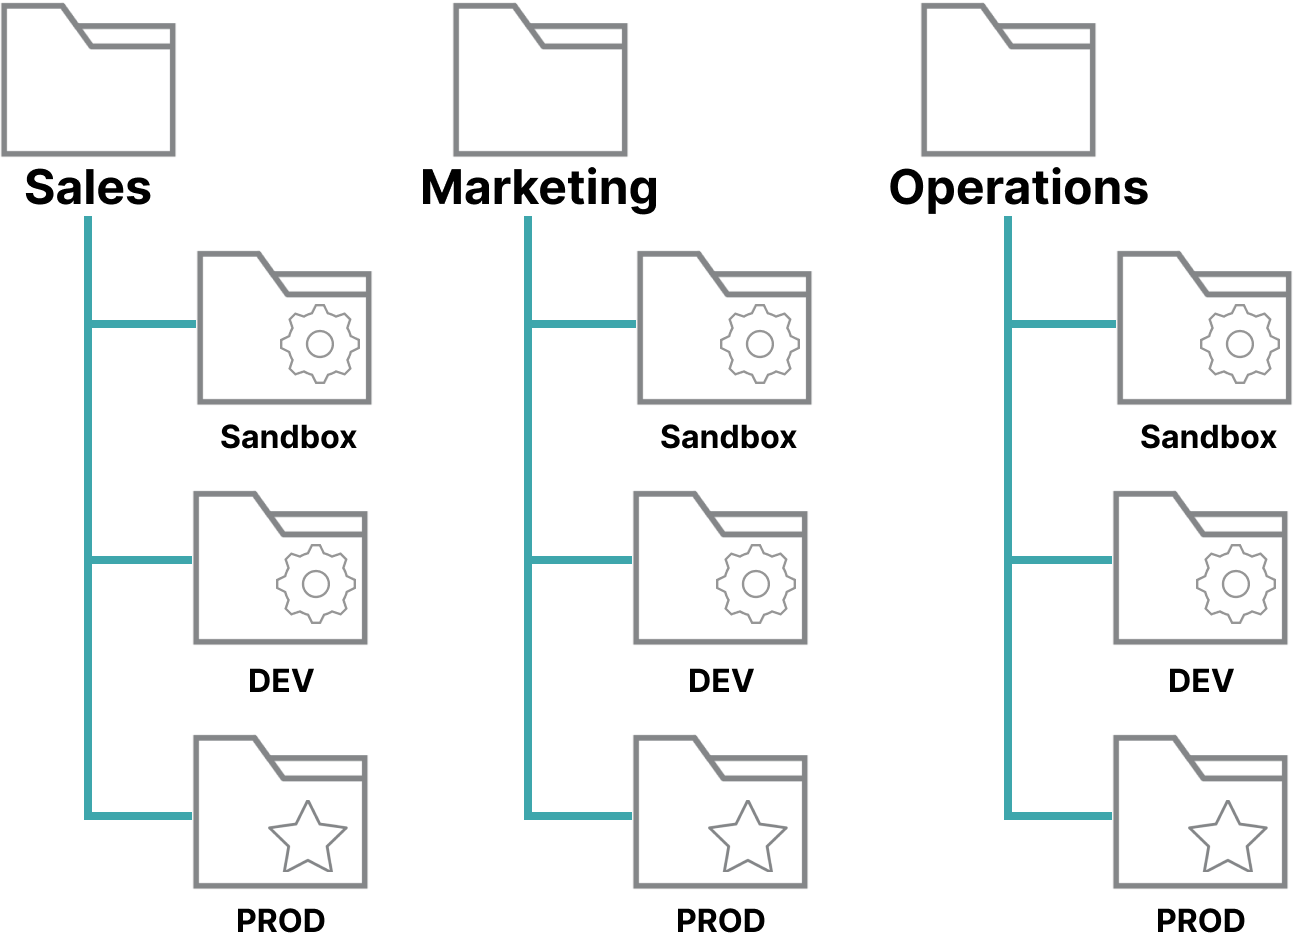
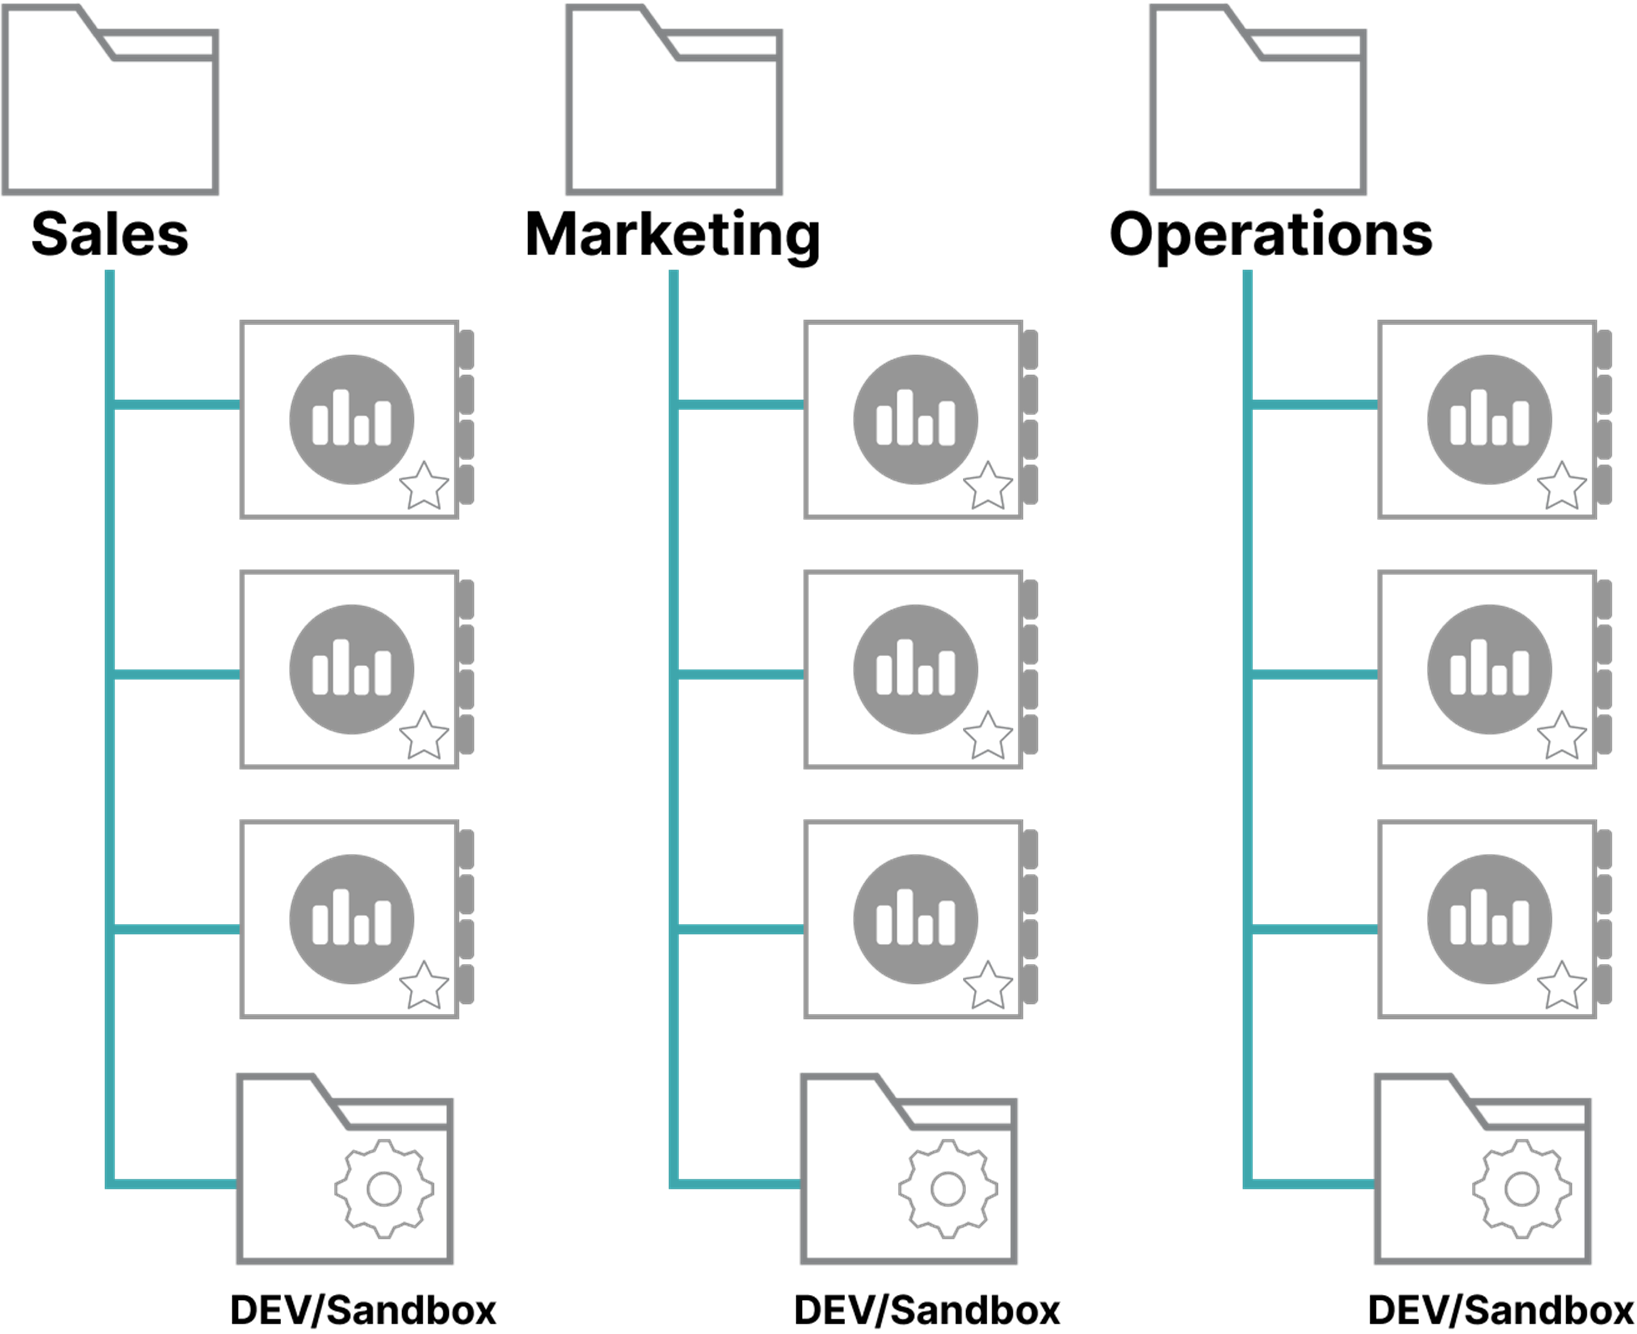
The above example is an approach we commonly see where the Sandbox, DEV and PROD is replicated across several business functions; depending on your organization, the principle may be similar but nuanced. The next diagram depicts a slight variation, in which PROD content sits directly inside the parent project, and a single sub-project is used to discern any non-production content, such as DEV, Sandbox or Archives. As long as you are consistent with that sub-folder structure, that is key.
Principle #2
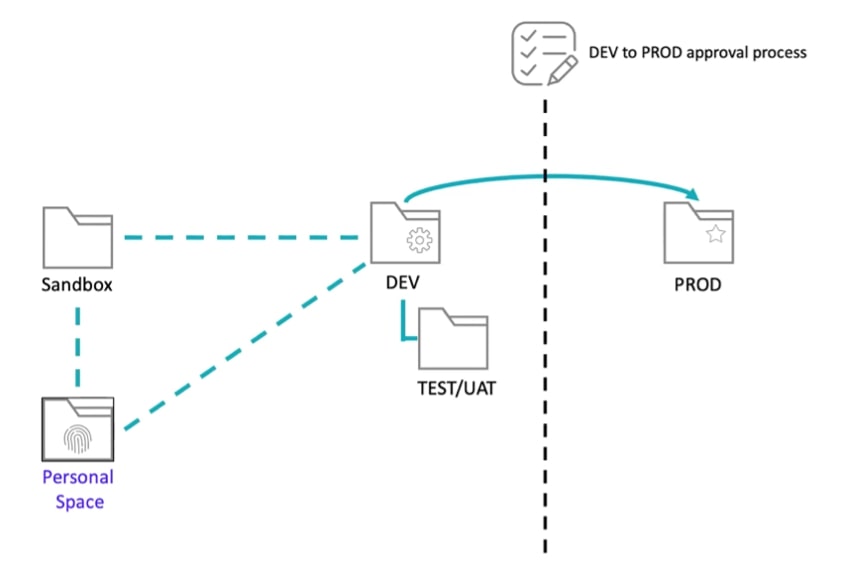
This is where content is in the DEV location for the purpose of promoting to PROD following an approval process. Below is what this looks like in practice:
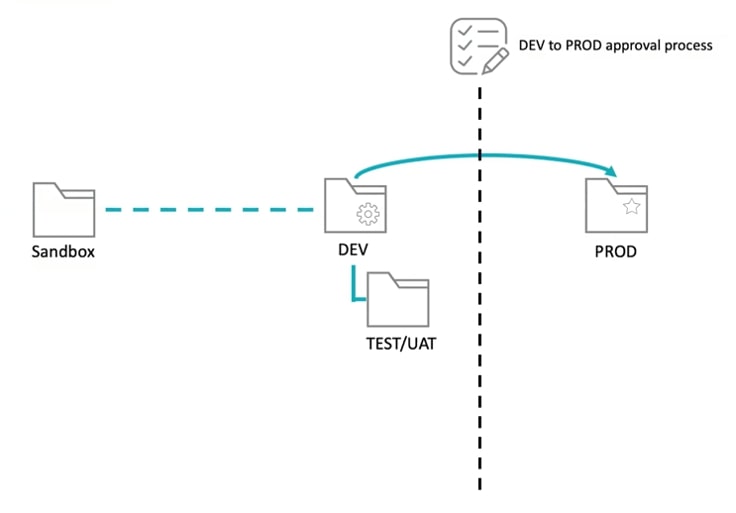
If we think about the folders, we know that Sandbox sits a little more independently from DEV and PROD. We recommend building out your dashboard in the Sandbox and then, when it is ready to go into the approval process, republishing into the DEV folder before wider circulation in PROD. Our PROD folder is where we hold the quality assured and highly vetted content.
As of Tableau version 2021.3, we now have the Personal Space feature. It exists as a private space for every user to publish content, whether to Tableau Server or Tableau Cloud. We love this!
Also, below are samples of the DEV to PROD approval checklist that we would highly recommend:
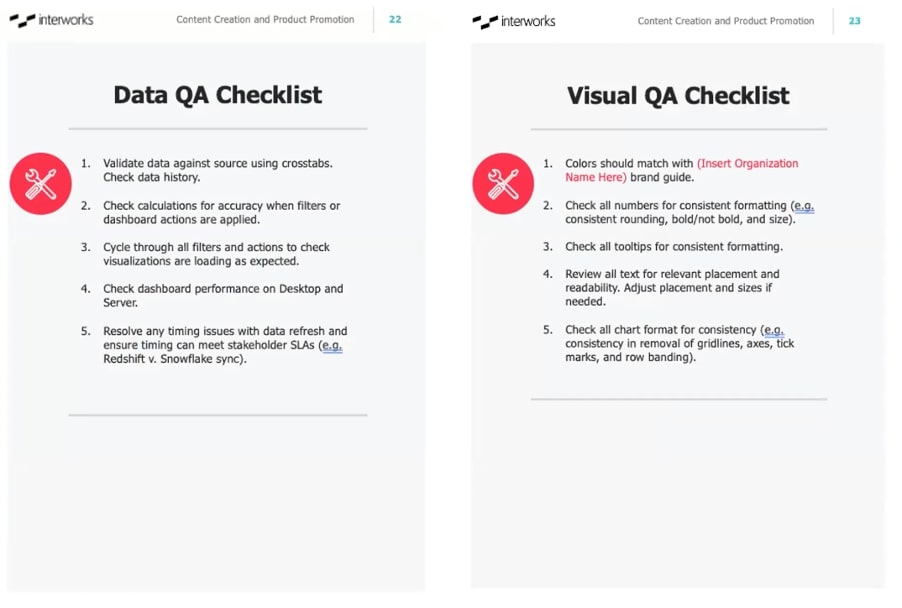
A lot of times, our clients will have a couple of checklists that they apply, with the first being the Data Quality Assurance (QA) Checklist. Again, please note that these will vary by organization. The second is the Visual QA Checklist, which makes sure there is consistency across dashboards. This is where you would typically utilize your brand guide. Peer review is also a great way to ensure that checks, checks and more checks are done.
Principle #3
Each location (Sandbox, DEV and PROD) has specific restrictions and capabilities. After reading thus far, you should see that each of our locations has very different use cases and functions. The principle here is that we are trying to balance mitigating a risk while still enabling self-service analytics:
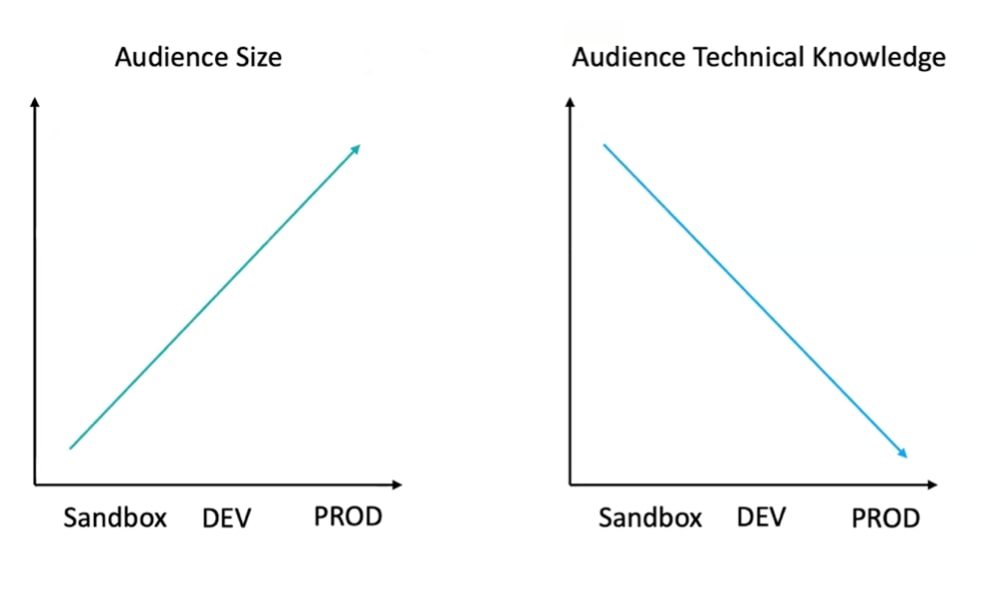
Looking at the image on your left, you’ll see that your Sandbox audience size will be small. The Sandbox users typically consist of developers who are doing that ad hoc analysis. As we move to the DEV environment, the number of users will increase to include those who are involved in the development process and people who are working in UAT. The PROD folder is going to have the broadest range of users, including those who will interact and consume the content created. Conversely, audience technical knowledge is in reverse when we look at audience technical knowledge as illustrated in the image on the right.
Here’s how it looks in practice.
When looking at data connections, we would recommend discussions around which folders have access to external data sources and which connect just to the Tableau-Server-hosted data sources:
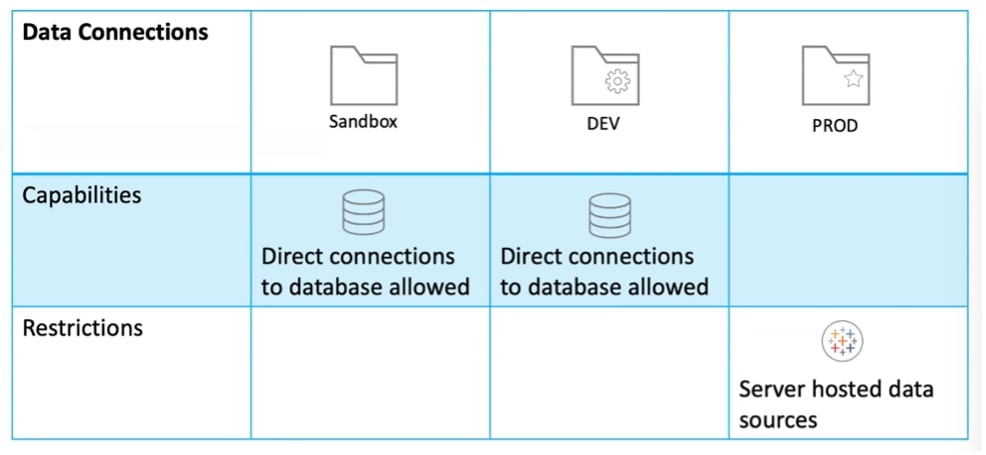
While our working recommendation is the above, there are lots of benefits to having only the PROD folder limited in data connections:
- You can have multiple workbooks connected to the same Server-hosted data source, which promotes consistency as that data source will have the same field information, metadata and calculations across multiple workbooks and dashboards.
- The biggest benefit of all is efficiency. Refreshing one data source across all of your workbooks/dashboards is a much better use of your Tableau resources than refreshing multiple embedded connections directly to the database.
- Another benefit is thinking through extract refresh schedules. You will make a lot of decisions on the content held in PROD, so you will want to make sure that the refresh is happening on a regular and predictable schedule. Because the content in the Sandbox and DEV folders is of a more temporary nature, you won’t necessarily need that regular refresh schedule. Refreshing extracts is one of the most resource-intensive activities for Tableau, so we would aim to reserve that horsepower for our production-level content.
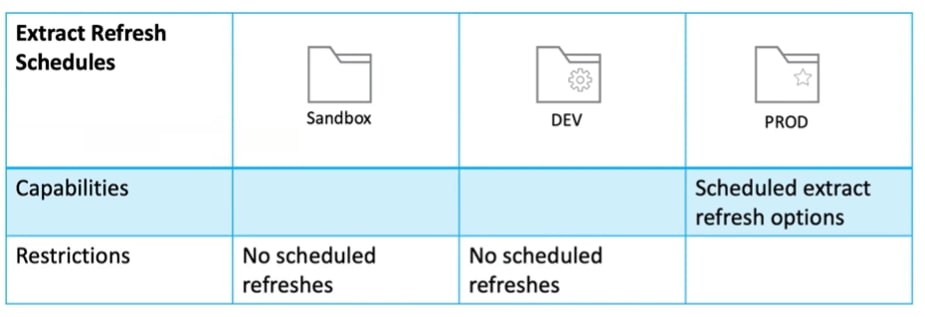
Here’s another example. Should you have data management for Tableau Server or Tableau Cloud, you can make use of certified data tagging in regard to your published and quality data-assured data sources:

Similarly, if you have Tableau Catalog in Data Management, it allows you to add more metadata. We would recommend this in the PROD environment, but you can relax the rules in the Sandbox and DEV folders:
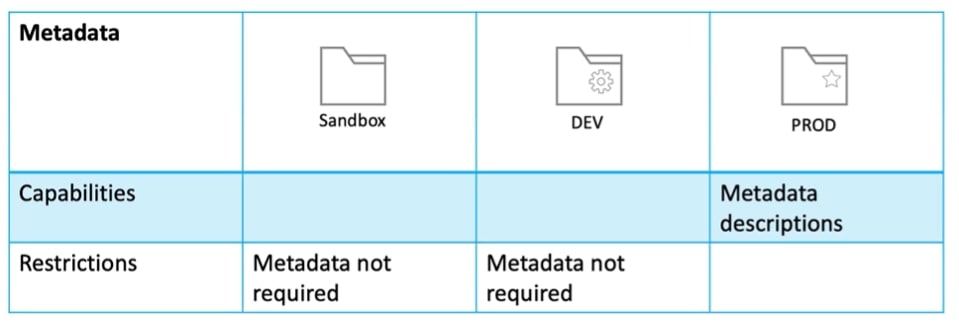
A Note to Tableau Cloud Users with On-Premises Data
Tableau Bridge is required to keep your on-premises data fresh in Tableau Cloud (think file-based, SQL Server or private cloud sources). Although there’s plenty to know about Tableau Bridge, let’s discuss what may factor into your governance strategy. Most notably, Tableau Bridge requires that any on-premises data be published to the server for refresh eligibility. This means that regardless of whether your on-premises data supports workbooks in Sandbox, DEV or PROD, that source must be Published (also known as Hosted) to stay fresh.
But didn’t the Data Connections chart suggest direct connections to the database, at least on Tableau Server?
Yes! That’s where this principle can be modified for Tableau Cloud. Since direct connections (also known as embedded connections) to on-premises data aren’t supported by Tableau Bridge, here are your options for data sources in Sandbox and DEV:
- Establish a direct connection to the on-premises data in Tableau Desktop, extract the data within your workbook and publish your workbook to the Sandbox or DEV locations on your Cloud site without a refresh schedule. As we learned in Principle #3, it’s best to save resource-intensive refresh activities for PROD anyways. When comes time to move that workbook to production, publish the data source to the Cloud site and reconnect your workbook to the published data source which is now eligible for refresh with Tableau Bridge.Consideration: Embedded data source extracts cannot be refreshed in Tableau Cloud. If you wish to push new data into these workbooks, you’d have to download to your local machine, refresh the extract and republish the workbook again without a refresh schedule.
- Publish all on-premises data sources to the Cloud site and into the projects that reflect their stage of development. Just as you’d move a workbook from Sandbox to DEV to PROD once it has been vetted, so too will you advance your data source.Consideration: It may be tempting to create refresh schedules on these published data sources in Sandbox and DEV just because they are Tableau Bridge compliant, but keep in mind that refresh extract tasks should be prioritized for sources in PROD.
As for those data sources in PROD, these should (and in the case of on-premises data connections, must be) Server-hosted. For specific questions on Tableau Bridge, don’t hesitate to reach out or read on.
Principle #4
Roles, responsibilities and maintenance differ for each location. As you have seen our intentions among our various folders differ, as well as the capabilities, we want to think about allowing or restricting. The main thing we want to highlight here is that you want to separate duties that happen across each project folder.
This is a look at maintenance in practice:
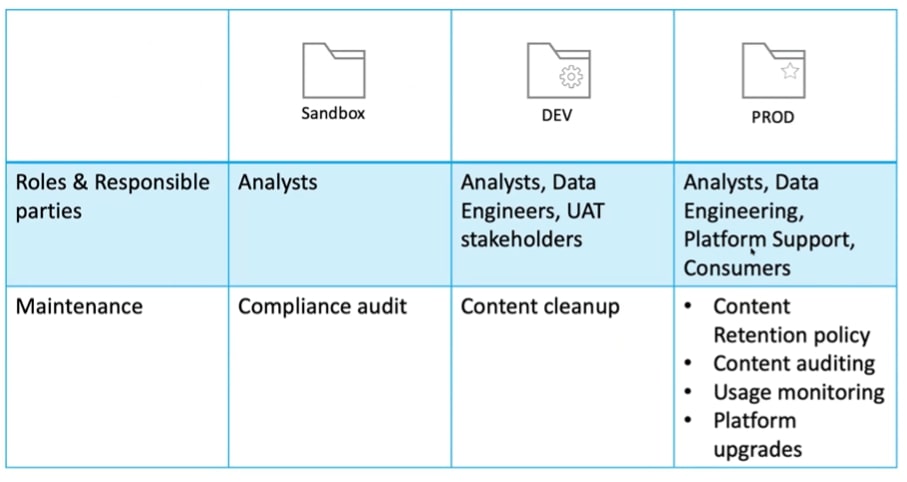
Note that if you’re using Tableau Bridge on Tableau Cloud, regular maintenance for Bridge will likely be the responsibility of Platform Support or IT to ensure that data in PROD stays fresh.
It’s important to have a clear view of who is involved when and to see that there is a different level of effort in maintaining each of these environments.
Principle #5
Finally, content in Production should be treated like products. Due to the number and level of the stakeholders working in PROD, the end product should be treated like a new product launch:
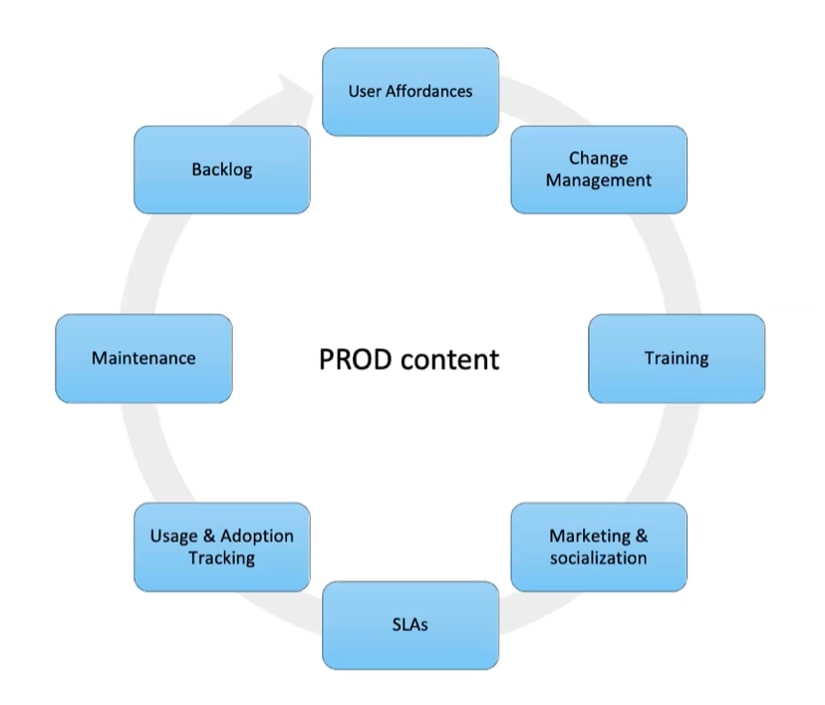
Thinking about the content launch cycle being similar to a product launch, there are a lot of different factors to consider to ensure that it is successful:
- User Affordances – These are things like help documentation, tutorials, and if people want to ask questions, they know to whom to direct those.
- Change Management – There are a lot of instances when a new dashboard is replacing an old report, and it’s important to give the user a heads up, so the stakeholders are ready to consume the new content.
- Training and Enablement – Sometimes, our audience is not that familiar with data or navigating Tableau dashboards. In these cases, a call to walk through the dashboard can be beneficial.
- Marketing and Socialization – This is frequently overlooked, but it is important to promote that new/refreshed content is now available. Create a cadence in a meeting, so people are aware of updates.
- SLAs – Make sure everyone is on the same page with service level agreements when new data is available in dashboards.
- Usage and Adoption Tracking – Utilizing those administrative views in Tableau Server is a great way to understand what content is resonating with the users.
- Maintenance – Once it is launched, it will eventually require updates, implementing feedback from users or updating the data connections.
- Backlog – Tracking changes and iterations of dashboards is a great tool when working through the iterations in the PROD environment.
Supporting content in the PROD environment is very important, which is why we promote the new product launch mentality in governance.
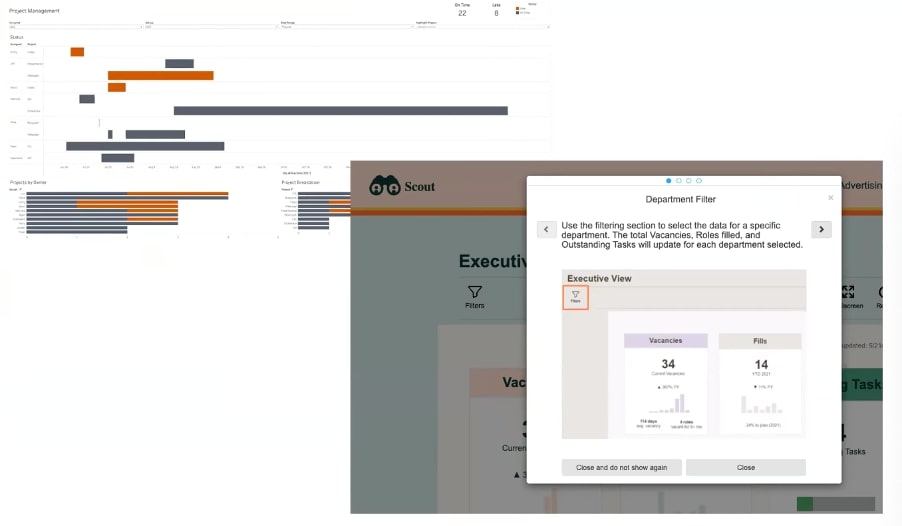
In practice, we see some customers apply a sprint methodology to dashboard deployment then add milestones. You can also see an example of a tutorial within the dashboard to support users in understanding how to navigate the dashboard:
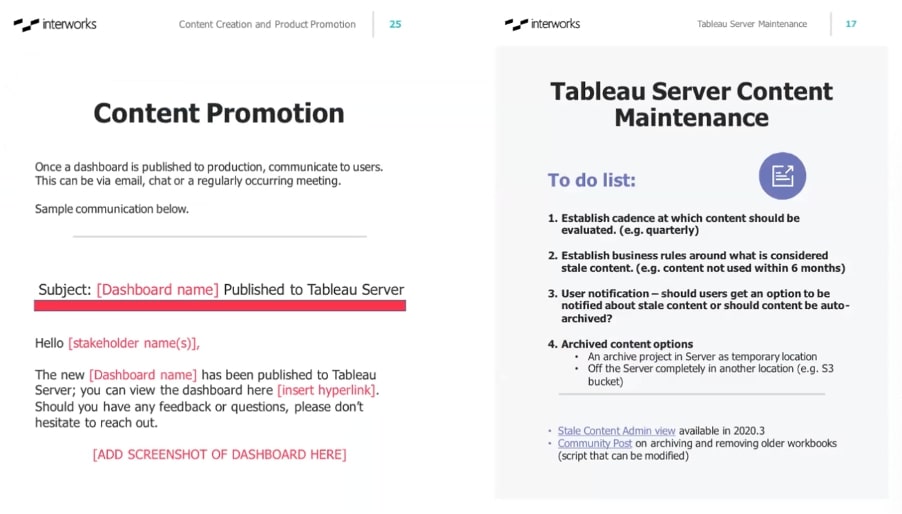
Alternatively, in terms of resources, we also have provided various templates to different customers:
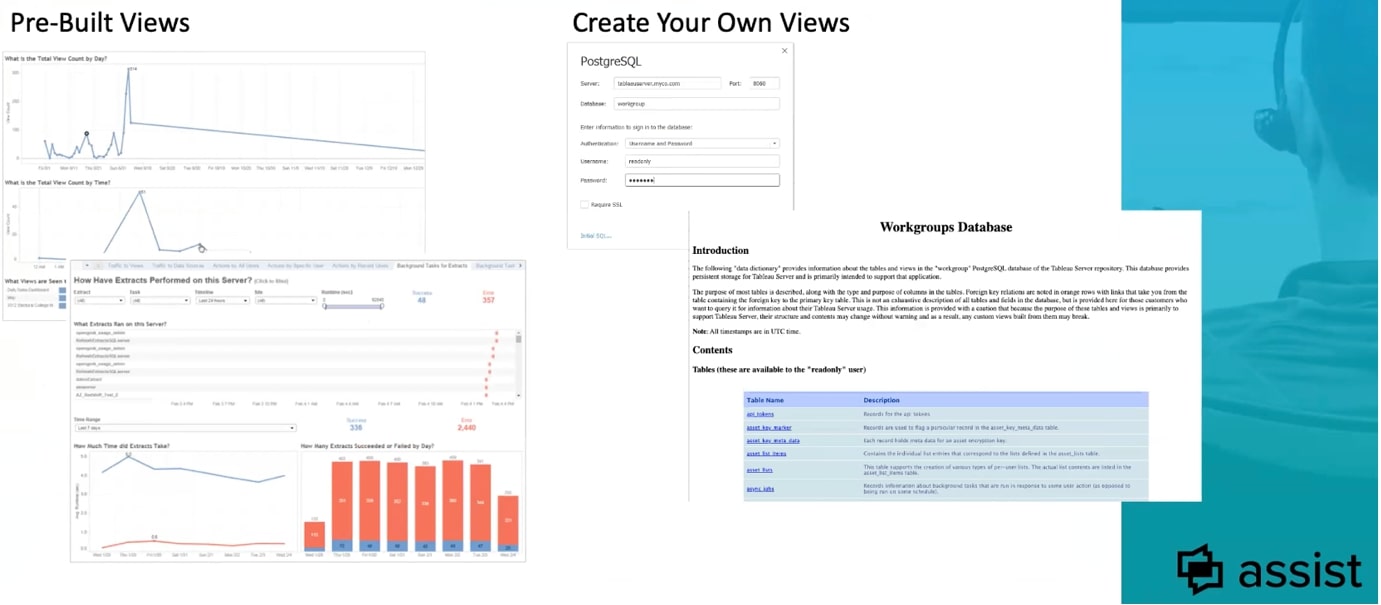
For anyone who is unaware, you do have an administrative view available in Tableau Server as long as you have enabled the Postgres repository. However, you may want to create your own views and this is possible also:
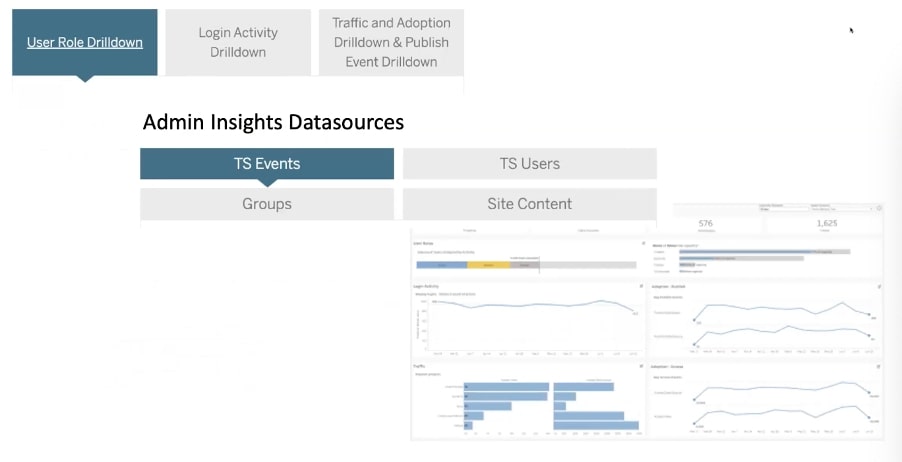
The parallel to this if you are using Tableau Cloud is that you have access to the Admin Insights Starter Workbook. Again, these workbooks can also be tailored to understand your usage and adoption and inform your governance policies:
Want to Learn More?
At InterWorks, we are dedicated to empowering and equipping people with the knowledge and tactical how-tos to make the most of their data environment. Here’s just a taste of what we can help you with:
- Best practice templates
- Change management strategies
- Measurement and management paths
- Scripted automation
- Assessment of your current governance policies and processes
- Tableau Server to Cloud migrations
- Tableau Bridge administration
Reach out to our team to learn more about how we can partner together in service of your greatest success. We’d love to help! And in the meantime, check out the full webinar recordings broken out by region below.
Webinar Replay – US
Webinar Replay – APAC
Webinar Replay – EMEA

